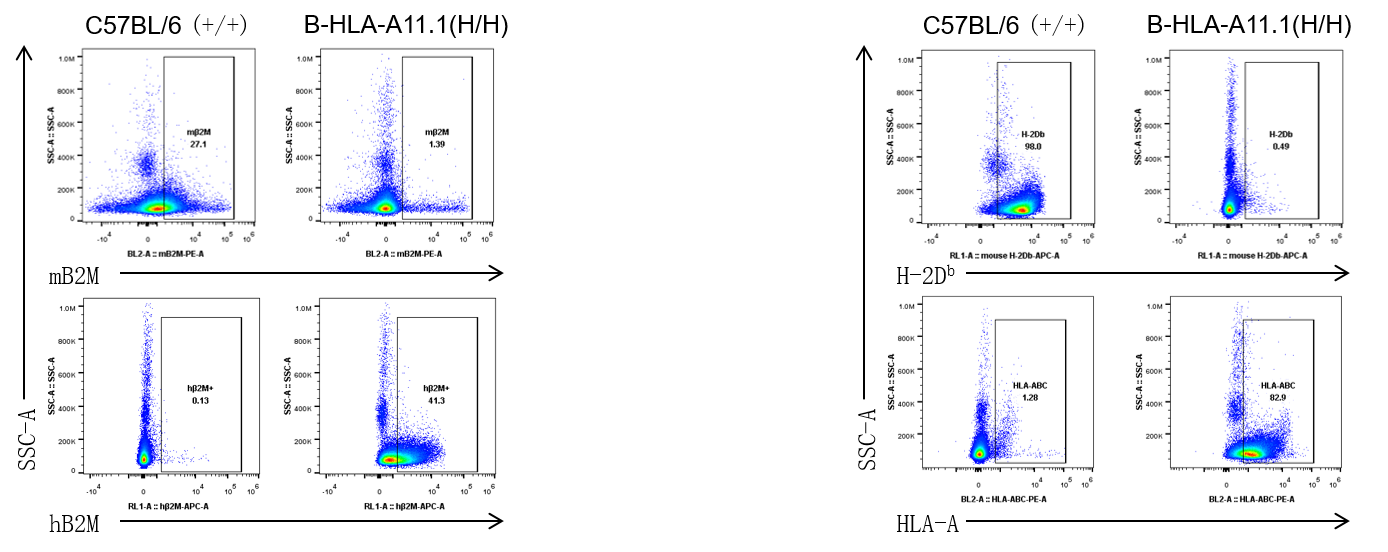
B2M and HLA-A11.1 Protein Expression Analysis
- Mouse B2M and H-2Db were detected exclusively in wild-type C57BL/6 mice, but not in homozygous B-HLA-A11.1 mice.
- Human B2M and HLA-A11.1 were exclusively detected in homozygous B-HLA-A11.1 mice.
Strain specific B2M and HLA expression analysis in homozygous B-HLA-A11.1 mice by flow cytometry. Splenocytes from both wild-type C57BL/6 (+/+) and homozygous B-HLA-A11.1 mice (H/H) were analyzed by flow cytometry. B2M expression was analyzed by flow cytometry using species-specific anti-mouse B2M antibody (Biolegend, 154503) and anti-human B2M (Biolegend, 316305). HLA expression was analyzed by flow cytometry using species-specific anti-H-2Db antibody (Biolegend, 114607) and anti-HLA-A,B,C antibody (Biolegend, 311406).
Analysis of Leukocyte Subpopulations
- The frequencies of T cells, B cells, NK cells, DCs, neutrophils, monocytes, granulocytes, and macrophages in homozygous B-HLA-A11.1 mice were similar to those in C57BL/6 mice. The frequency of CD8+ T cells were significantly decreased, demonstrating that introduction of hB2M-HLA-A11.1-H-2D in place of mouse B2M affected the development of CD8 + T cells, which in turn affected the proportion of T cell subtypes in the spleen, blood, and lymph nodes.
Analysis of leukocyte subpopulations by flow cytometry in immune organs and blood. Splenocytes, peripheral blood, and lymph nodes were isolated from female C57BL/6 and B-HLA-A11.1 mice (female, 8-week-old, n = 3). Single live cells were gated on the CD45⁺ population and analyzed by flow cytometry as indicated. Values are expressed as mean ± SEM.
Analysis of T Cell Subpopulations
- The proportion of Tregs in homozygous B-HLA-A11.1 mice were comparable to those in C57BL/6 mice. The frequency of CD8+ T cells were significantly decreased while the frequency of CD4+ T cells were significantly increased, demonstrating that introduction of hB2M-HLA-A11.1-H-2D in place of mouse B2M affected the development of CD8 + T cells, which in turn affected the proportion of T cell subtypes in the spleen, blood, and lymph nodes.
Analysis of T-cell subpopulations by flow cytometry in immune organs and blood. Splenocytes, peripheral blood, and lymph nodes were isolated from female C57BL/6 and B-HLA-A11.1 mice (female, 8-week-old, n = 3). Single live cells were gated on the CD3⁺ T-cell population and analyzed by flow cytometry as indicated. Values are expressed as mean ± SEM.
Growth Curve
Growth curve of wild-type C57BL/6JNifdc and B-HLA-A11.1 mice. Eight-week-old mice were grouped by sex (10 males and 10 females). Body weight was measured on the same day of every two week, until 32 weeks. The minimum and maximum body weights shown in the table were calculated from the mean ± SD. The growth curve of the B-HLA-A11.1 mice was similar to the growth curve of C57BL/6JNifdc.
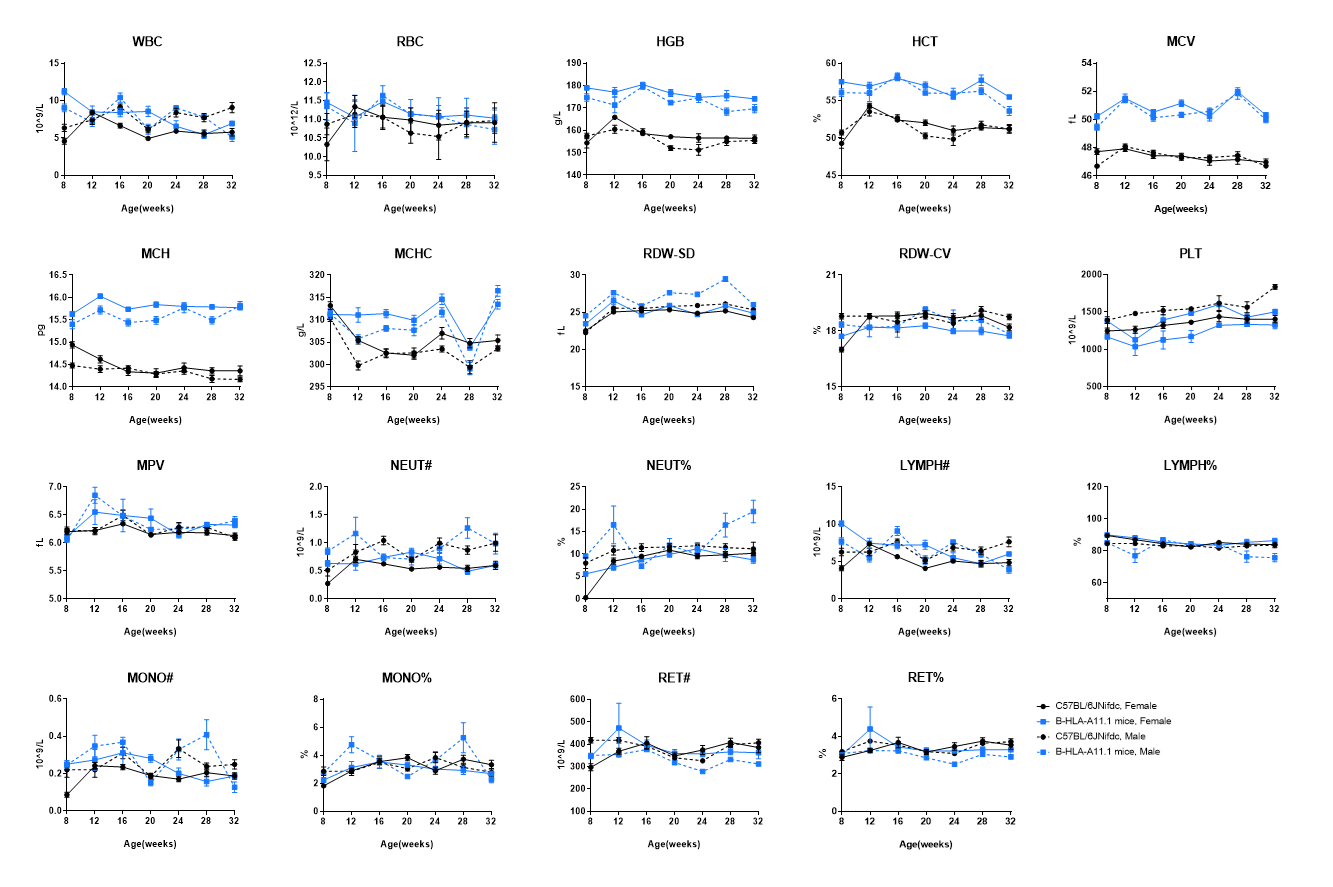
Hematology Analysis
Complete blood count (CBC) of B-HLA-A11.1 mice. Values are expressed as mean ± SD.
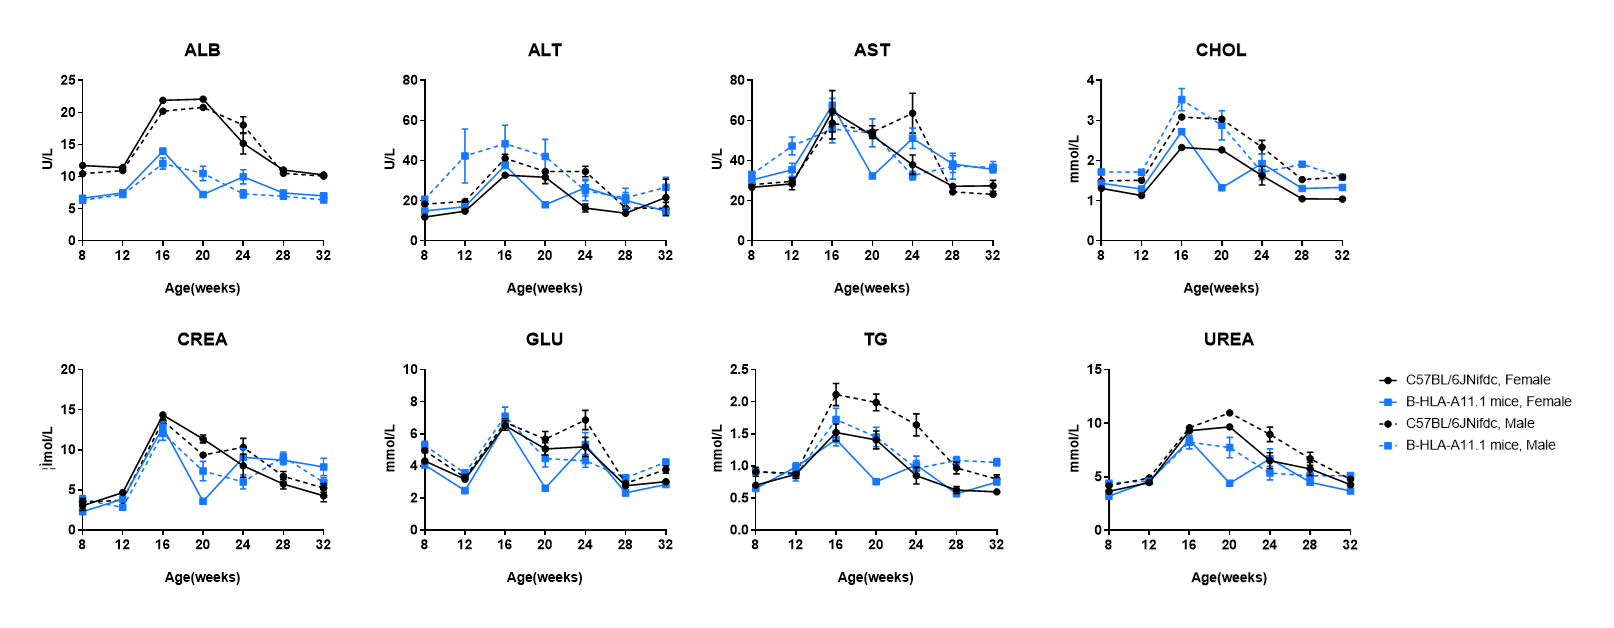
Blood Biochemical Analysis
- No significant differences were observed compared with wild-type mice.
Blood biochemical parameters of B-HLA-11.1 mice are shown. Values are expressed as mean ± SD.
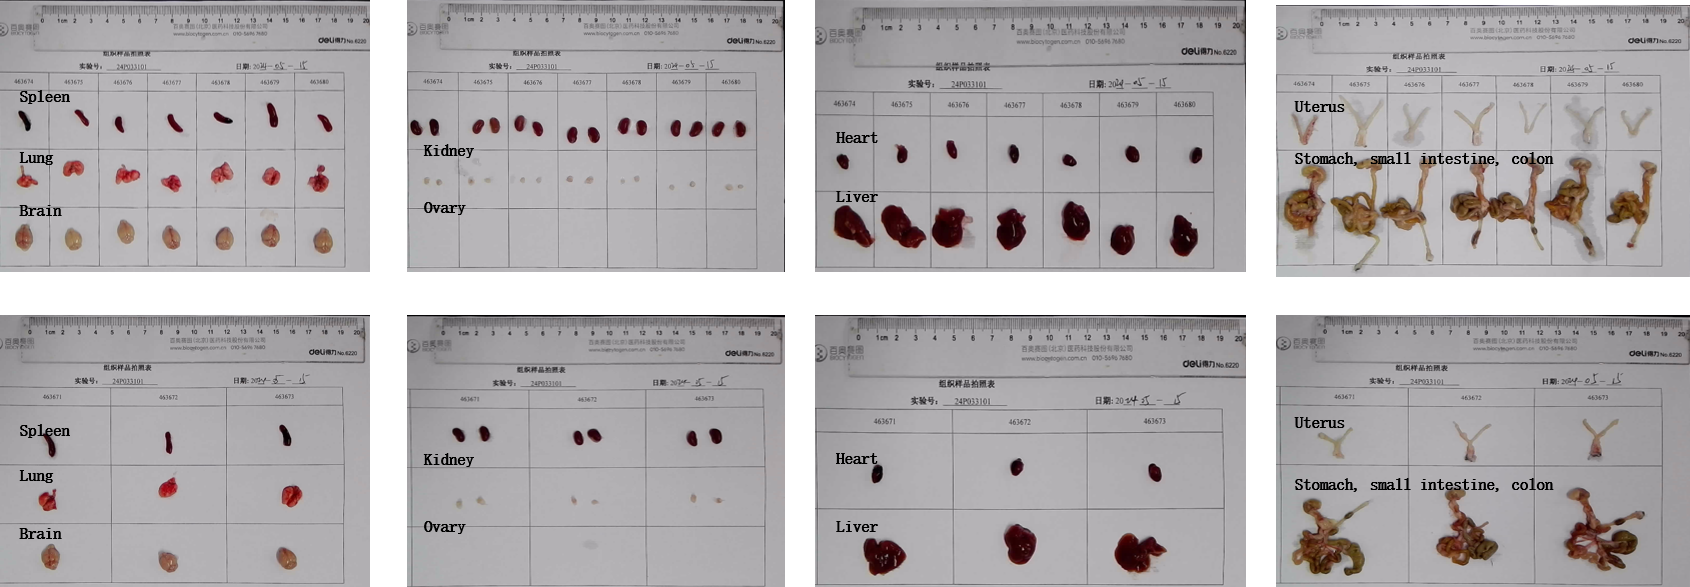
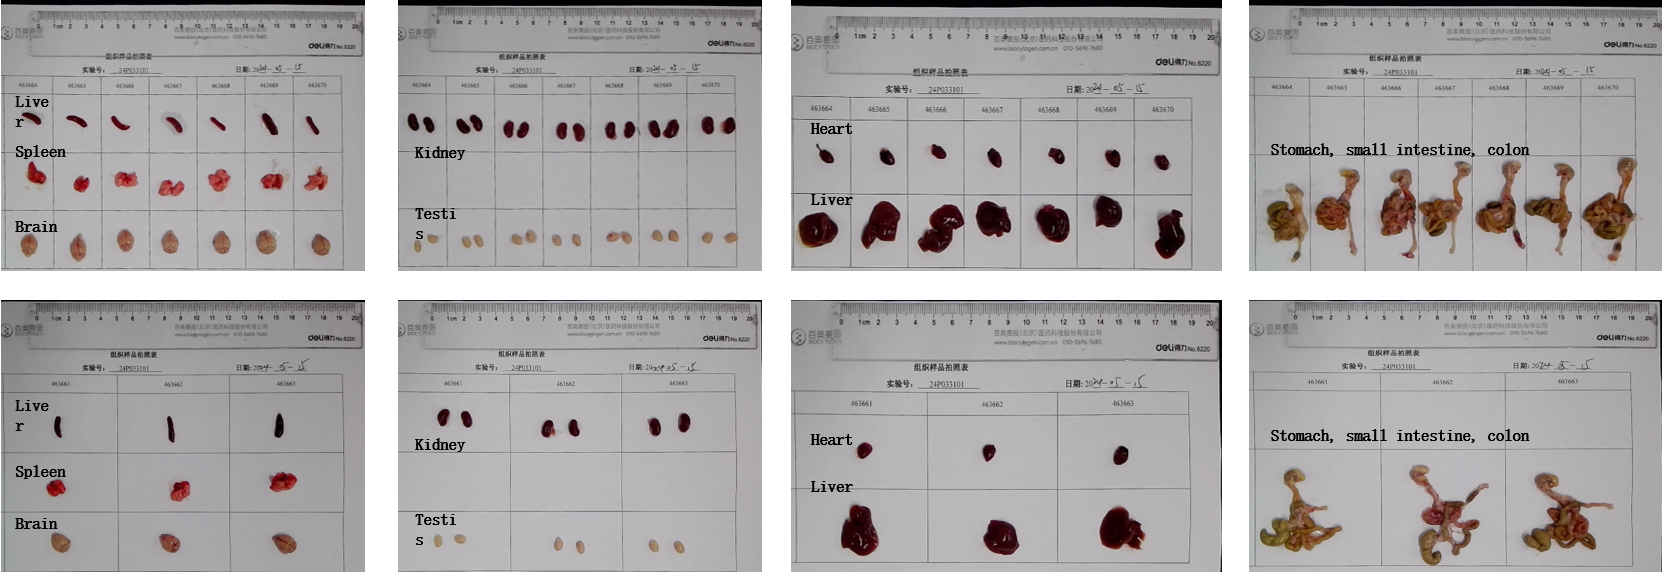
Gross Organ Anatomy (Female)
- No abnormalities were observed.
Organs of female B-HLA-A11.1 mice (8-week-old, n = 10).
Gross Organ Anatomy (Male)
- No abnormalities were observed.
Organs of male B-HLA-A11.1 mice (8-week-old, n = 10).
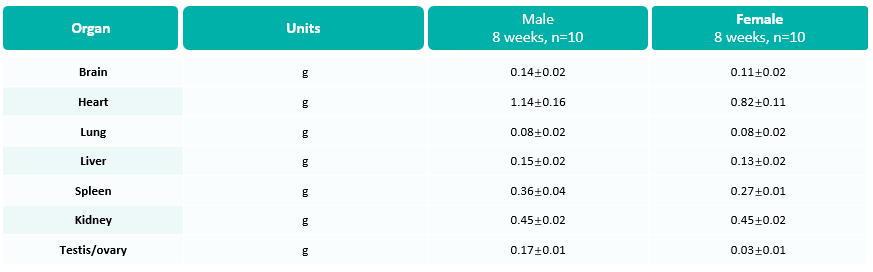
Organ Weight
- No abnormalities were observed.
Average weights of major organs in B-HLA-11.1 mice. Values are expressed as mean ± SD.
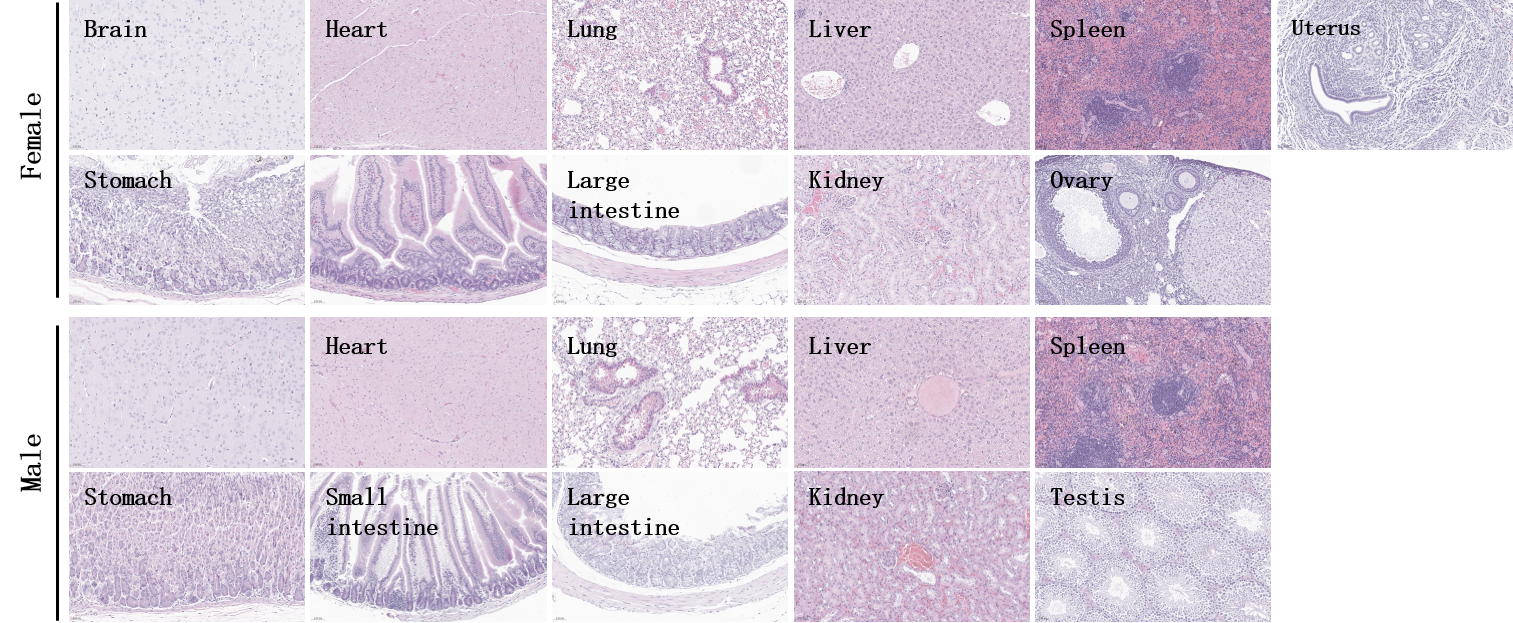
Histopathological Analysis
- No obvious abnormalities were observed in any organs examined (brain, heart, lung, liver, spleen, stomach, small intestine, colon, kidney, ovary, uterus ,testis, lymph node, thymus and bone marrow).
Histopathological analysis of organs in B-HLA-A11.1 mice. Major organs from B-HLA-A11.1 mice were collected at 32 weeks of age and analyzed by H&E staining (male, n = 10; female, n = 10).
Functional Validation
- KRAS-targeted peptide vaccines induced immune responses in B-HLA-A11.1 mice.
- The results demonstrate that B-HLA-11.1 mice provide a powerful preclinical model for in vivo evalsuation of peptide vaccines.

Detection of vaccine-induced immune responses in B-HLA-A11.1 mice by IFN-γ ELISpot assay. Female B-HLA-A11.1 mice at the age of 7-8 weeks were divided into PBS group, Group 2 and Group 3 (n = 2), and then inoculated PBS or vaccines at the inside muscle of both legs. Three weeks after the last immunization, mice were sacrificed. The splenocytes were extracted, stimulated with individual peptide or target-unrelated polypeptide as negative control (NC) or anti-CD3 as positive control, and then measured for IFN-γ secretion. No significant difference in body weight among groups (Data was not shown). (A) Representative results showing stimulation of splenocytes harvested from immunized mice with negative control, or peptide vaccines, or positive control in duplicates. (B) ELISpot Quantification: Statistical summary of IFN-γ-secreting cells.
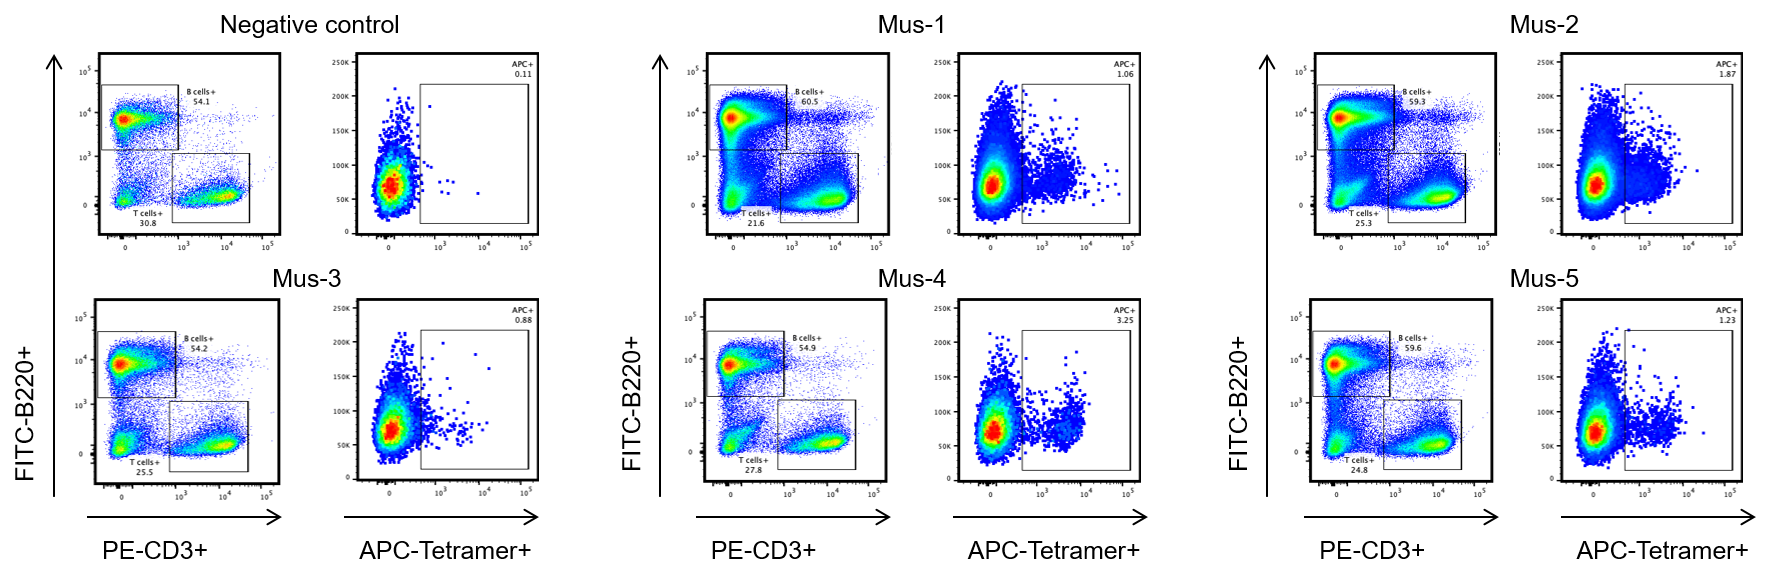
- Identification of target peptide specific TCRs from B-HLA-A11.1 mice.
Single-cell isolation of target peptide-specific T cells from B-HLA-A11.1 mice. B-HLA-A11.1 mice were subcutaneously immunized with the target peptide and the spleen cells from five mice displayed specific responses against the target peptide. Spleen cells from five mice (Mus-1, Mus-2, Mus-3, Mus-4 and Mus-5) that showed substantial target peptide specific responses were stained with target peptide/HLA-A*11:01 tetramer, and the tetramer positive CD8+ T cells were sorted by single-cell sorting with flow Cytometry. Mouse without target peptide immunization was enrolled as the negative control. These results demonstrated that the B-HLA-A11.1 mice could be used for identifying target peptide specific TCRs and investigating mechanisms of peptide presentation and TCR recognition of cancer targets epitopes in the context of HLA-A*11:01 (All results were provided by the client.)
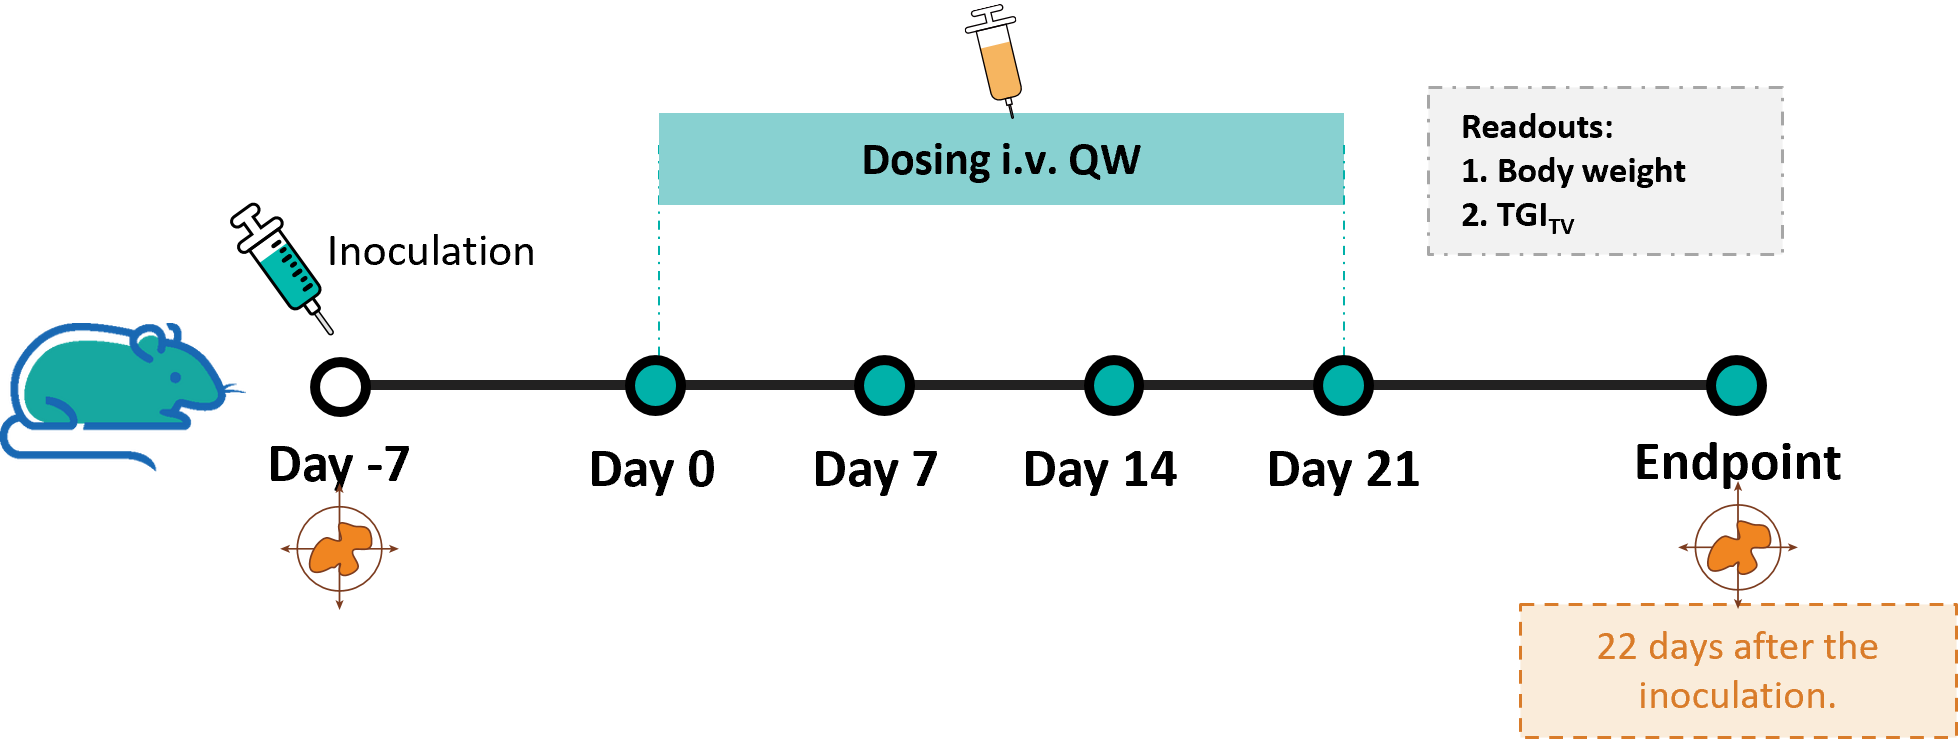
Anti-tumor Effect of LNP-mRNA against B-HLA-A11.1/hKRAS*G12V MC38 Tumor Cells
Establishment of a B-HLA-A11.1/hKRAS*G12V MC38 model and in vivo efficacy study of an anti-human NY-ESO-1 LNP mRNA. B-HLA-A11.1/hKRAS*G12V MC38 cells were implanted subcutaneously into homozygous B-HLA-A11.1 mice (female, 8-weeks-old, n=8).
Antitumor activity of KRAS*G12V mRNA vaccine against syngeneic tumors. (A) Tumor growth curves. (B) Body weight changes during treatment. (C) Tumor cells growth of individual mouse. These results demonstrate that B-HLA-A11.1 mice provide a powerful preclinical model for in vivo evalsuation of LNP-mRNA vaccines.
The overage of this tumor model is 40%.
Establishment of a B-HLA-A11.1/hKRAS*G12V MC38 model and in vivo efficacy study of an anti-human KRAS*G12V LNP mRNA. B-HLA-A11.1/hKRAS*G12V MC38 cells were implanted subcutaneously into homozygous B-HLA-A11.1 mice (female, 8-weeks-old, n=8).
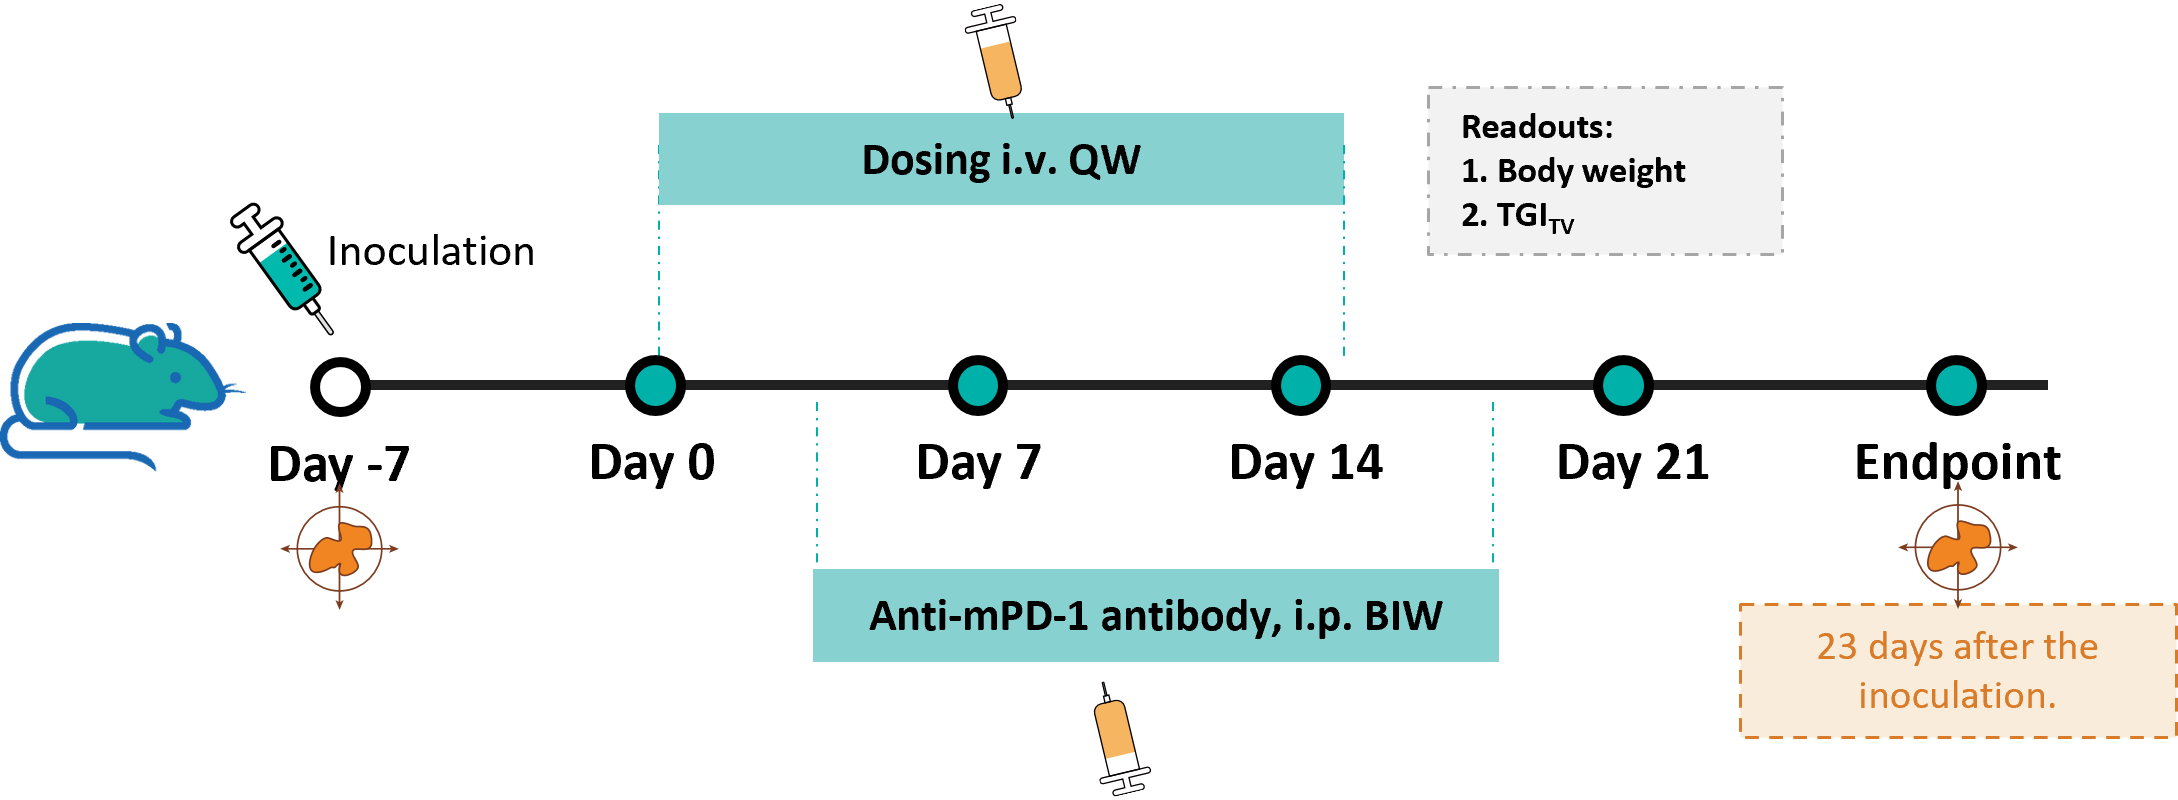
Anti-tumor Effect of Combination Therapy of mRNA and Anti-mouse PD-1 Antibody
Antitumor activity of anti-mouse PD-1 antibody combined with KRAS*G12V mRNA vaccine against syngeneic tumors. (A) Tumor growth curves. (B) Body weight changes during treatment. These results demonstrate that B-HLA-11.1 mice provide a powerful preclinical model for in vivo evalsuation of LNP-mRNA vaccines. The overage of this tumor model is 40%.
Anti-tumor Effect of LNP-mRNA against B-HLA-A11.1/hKRAS*G12V MC38 Tumor Cells
Antitumor activity of anti-mouse PD-1 antibody combined with KRAS*G12V mRNA vaccine against syngeneic tumors. B-HLA-A11.1/hKRAS*G12V MC38 tumor cells growth of individual mouse.
Establishment of a B-HLA-A11.1/hKRAS*G12V MC38 model and in vivo efficacy study of an anti-human KRAS*G12V LNP mRNA. B-HLA-A11.1/hKRAS*G12V MC38 cells were implanted subcutaneously into homozygous B-HLA-A11.1 mice (female, 8-weeks-old, n=8).
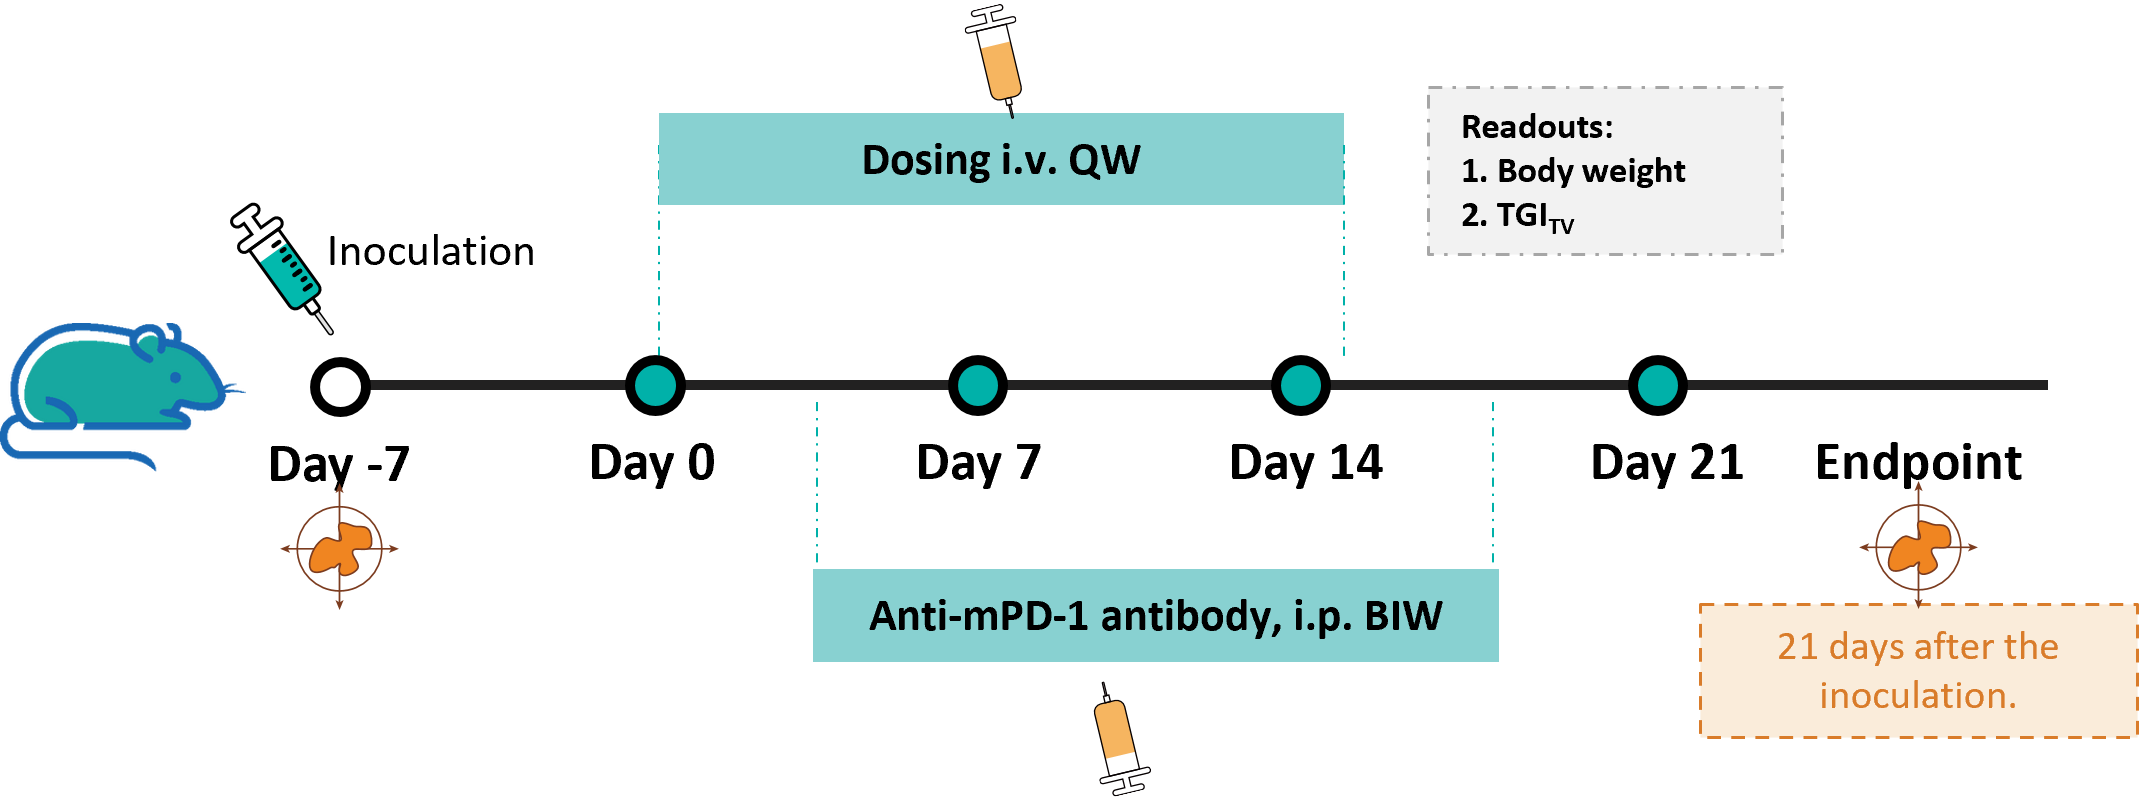
Anti-tumor Effect of Combination Therapy of mRNA and Anti-mouse PD-1 Antibody
Antitumor activity of anti-mouse PD-1 antibody combined with KRAS*G12V mRNA vaccine against syngeneic tumors. (A) Tumor growth curves. (B) Body weight changes during treatment. These results demonstrate that B-HLA-11.1 mice provide a powerful preclinical model for in vivo evalsuation of LNP-mRNA vaccines. The overage of this tumor model is 40%.
Anti-tumor Effect of LNP-mRNA against B-HLA-A11.1/hKRAS*G12V MC38 Tumor Cells
Antitumor activity of anti-mouse PD-1 antibody combined with KRAS*G12V mRNA vaccine against syngeneic tumors. B-HLA-A11.1/hKRAS*G12V MC38 tumor cells growth of individual mouse.
* When publishing results obtained using this animal model, please acknowledge the source as follows: The animal model [B-HLA-A11.1 mice] (Cat# 112803) was purchased from Biocytogen.