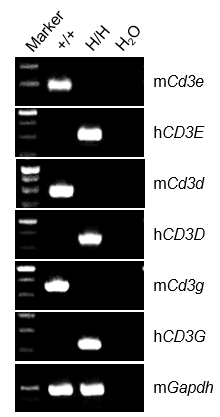
CD3E, CD3D, CD3G mRNA Expression by RT-PCR
- Humanized CD3E, CD3D and CD3G mRNA were detectable only in thymus of homozygous B-hCD3EDG mice (H/H), but not in wild-type C57BL/6 mice (+/+).
- Mouse Cd3e, Cd3d and Cd3g mRNA were detectable only in thymus of wild-type C57BL/6 mice (+/+).
Mouse and human CD3E, CD3D, CD3G analysis in thymus by RT-PCR and sequencing. Thymus RNA was isolated from wild-type C57BL/6 mice (+/+) and homozygous B-hCD3EDG mice (H/H), and then cDNA libraries were synthesized by reverse transcription, followed by PCR with mouse or human CD3E, CD3D, CD3G primers.
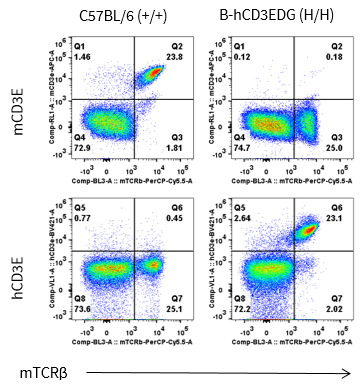
CD3E Protein Expression in Spleen
- Human CD3E was detected on T cells populations in B-hCD3EDG mice, but not in wild-type C57BL/6 mice.
- Mouse CD3E was detected on T cells populations in wild-type C57BL/6 mice, but not in B-hCD3EDG mice.
Mouse and human CD3E expression analysis in splenocytes. Splenocytes were collected from wild-type C57BL/6 mice (+/+) and homozygous B-hCD3EDG mice (H/H), and analyzed by flow cytometry with species-specific anti-mouse CD3ε antibody (Biolegend, 100312, clone 145-2C11) and anti-human CD3ε antibody (BD Pharmingen, 562426, clone UCHT1).
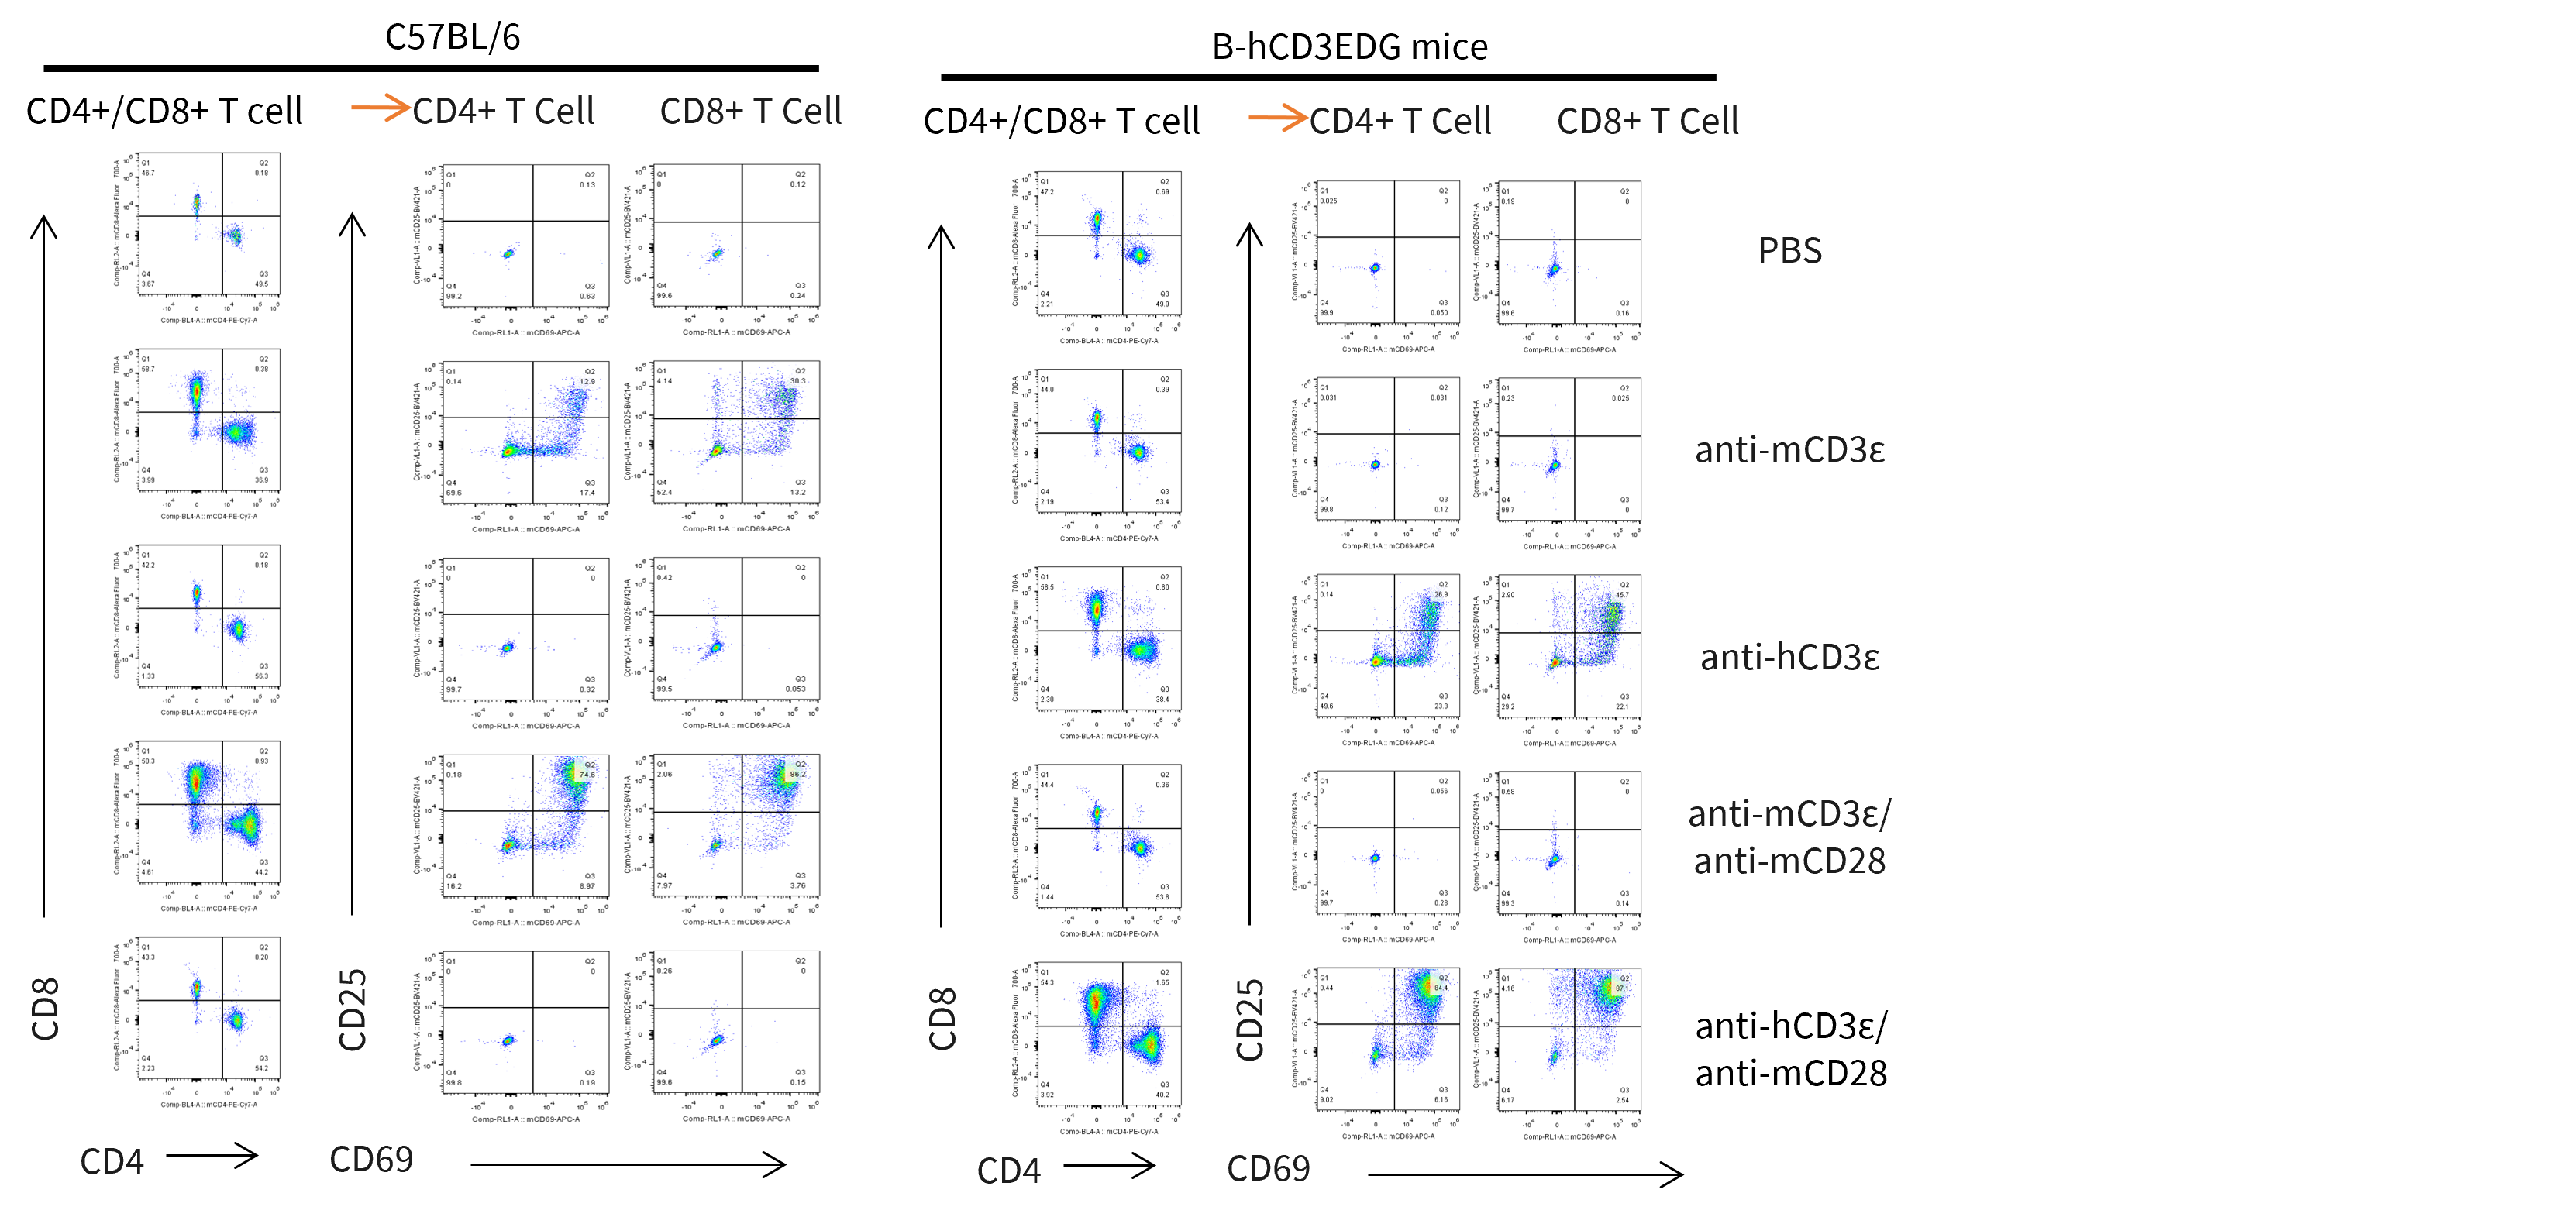
In Vitro T Cell Activation
- T cell activation in B-hCD3EDG mice was significantly up-regulated by anti-hCD3ε antibody, similar to the activation level shown in C57BL/6 mice treated with anti-mCD3ε antibody.
In vitro T cells activation. T cells (2×10⁵) were isolated from splenocytes of C57BL/6 and B-hCD3EDG mice (n=3, 16-week-old), and were incubated in the presence of anti-mouse CD3ε antibody (BioXCell, BE0001-1, clone 145-2C11, 2ug/ml), anti-human CD3ε antibody (BioXCell, BE0001-2, clone OKT3, 2ug/ml) and anti-mCD28 antibody (BioXCell, BE0015-1, clone 37.51, 5ug/ml) for 48h. T cell activation was tested by flow cytometry.
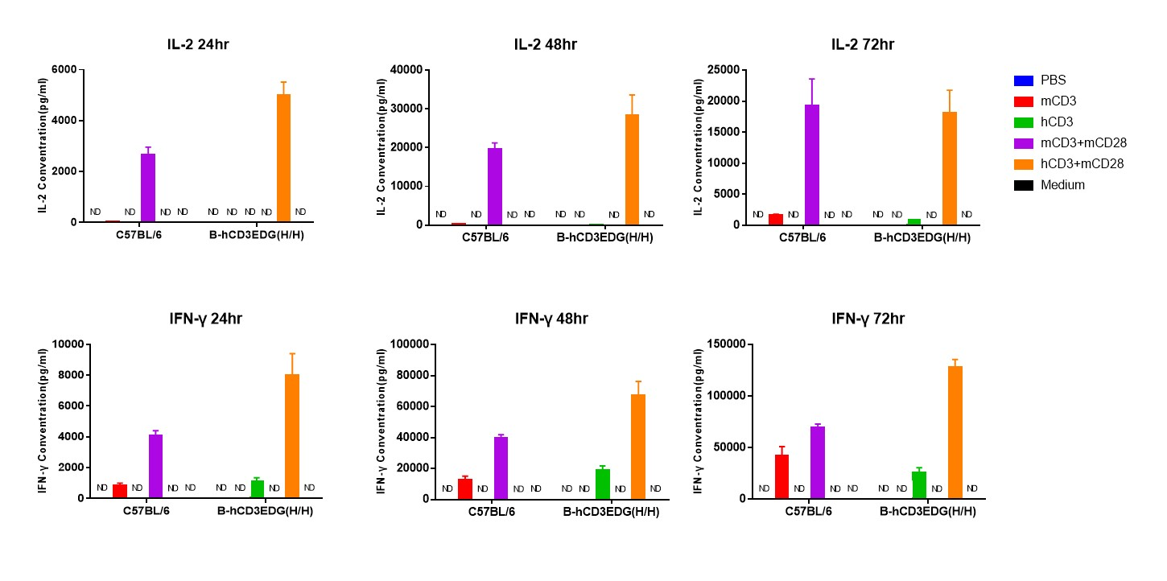
- T cell activation in B-hCD3EDG mice was significantly up-regulated by anti-hCD3ε antibody, similar to the activation level shown in C57BL/6 mice treated with anti-mCD3ε antibody.
In vitro T cells activation. T cells (2×10⁵) were isolated from the splenocytes of C57BL/6 and B-hCD3EDG mice (n=3, 16-week-old), incubated in the presence of anti-mouse CD3ε antibody (BioXCell, BE0001-1, clone 145-2C11, 2ug/ml), anti-human CD3ε antibody (BioXCell, BE0001-2, clone OKT3, 2ug/ml) and anti-mCD28 antibody (BioXCell, BE0015-1, clone 37.51, 5ug/ml) for 24h, 48h and 72h. IFN-γ and IL-2 productions were then tested using ELISA method. Values are expressed as mean ± SEM. ND: not detectable.
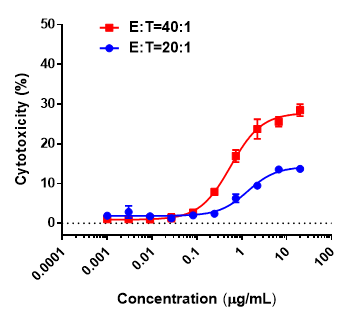
In Vitro T Cell Cytotoxicity
- The anti-CD3/BCMA bispecific antibody mediated dose-dependent cytotoxicity against B-hBCMA MC38 cells in the presence of effector cells.
- Increased tumor cell killing was observed with higher effector-to-target (E:T) ratioses.
In vitro cytotoxicity evalsuation of an anti-CD3/BCMA bispecific antibody against human BCMA–expressing MC38 Cells. Splenocytes of B-hCD3EDG mice were mixed with B-hBCMA MC38 and various concentrations of CD3/BCMA bispecific antibodies provided by the client were added. The killing activity was detected after 48 hours. When the ratio of effector cells to target cells (E:T) were 20:1 and 40:1, the killing effect of the test sample was detected.
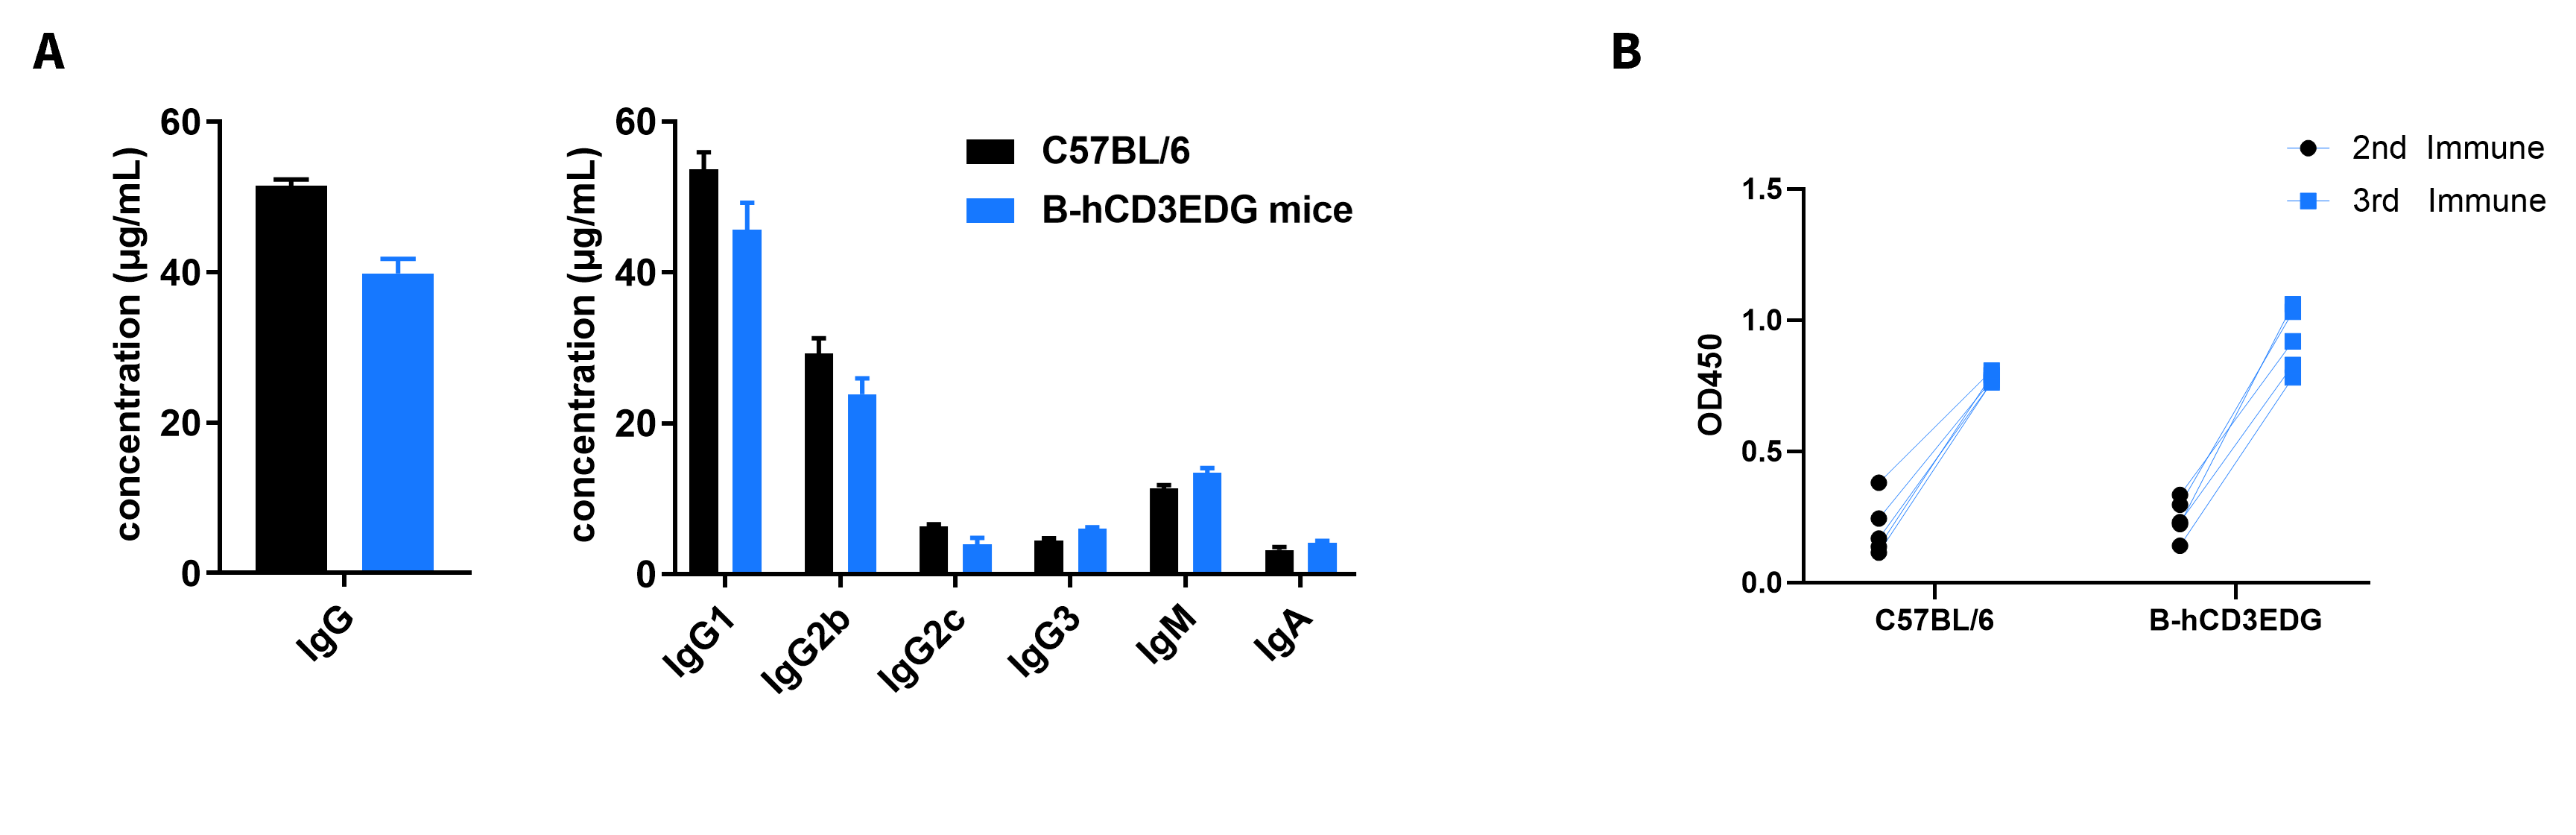
Serum Titers of OVA-specific Antibodies
- The levels of antibodies titers of B-hCD3EDG mice before immunization were similar to those in C57BL/6 mice, and the specific antibody titers in the serum of each mouse were significantly increased after the third immunizations.
- Introduction of hCD3EDG instead of its mouse counterpart did not affect the humoral immune response of mice.
Serum Titers of OVA-Specific Antibodies. B-hCD3EDG mice (n=5, 6-week-old) were immunized three times with OVA, 2 weeks apart. Blood samples were collected a week after immunization. (A) Quantification of serum subtypes of mice before immunization. (B) Serum titer test of mice after the second and third immunizations.
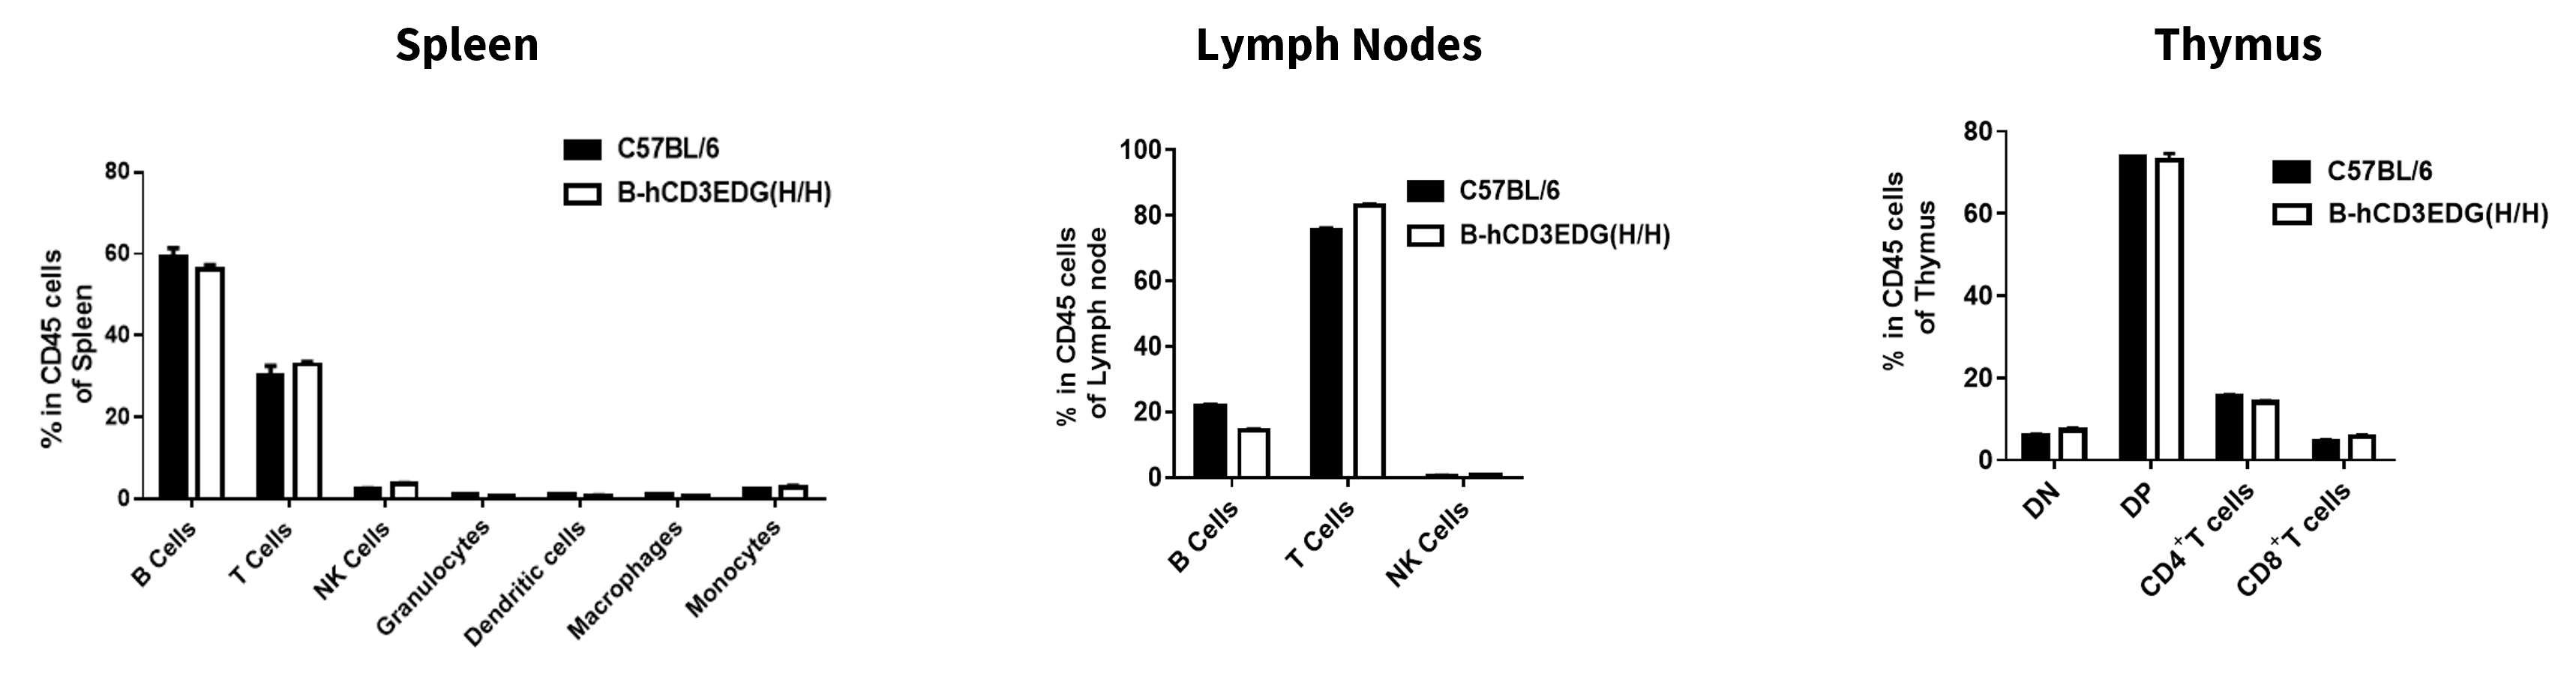
Analysis of Leukocyte Subpopulations
- The frequencies of T cells, B cells, NK cells, Granulocytes, Dendritic cells, Monocytes, and Macrophages in homozygous B-hCD3EDG mice were similar to those in C57BL/6 mice.
- Humanization of CD3E, CD3D, and CD3G does not affect normal immune cell development and distribution.
Analysis of leukocyte subpopulations by flow cytometry in immune organs. Splenocytes, lymph nodes, and thymus were isolated from C57BL/6 and B-hCD3EDG mice (7-week-old, n = 3). Single live cells were gated on the CD45⁺ population and analyzed by flow cytometry as indicated. Values are expressed as mean ± SEM.
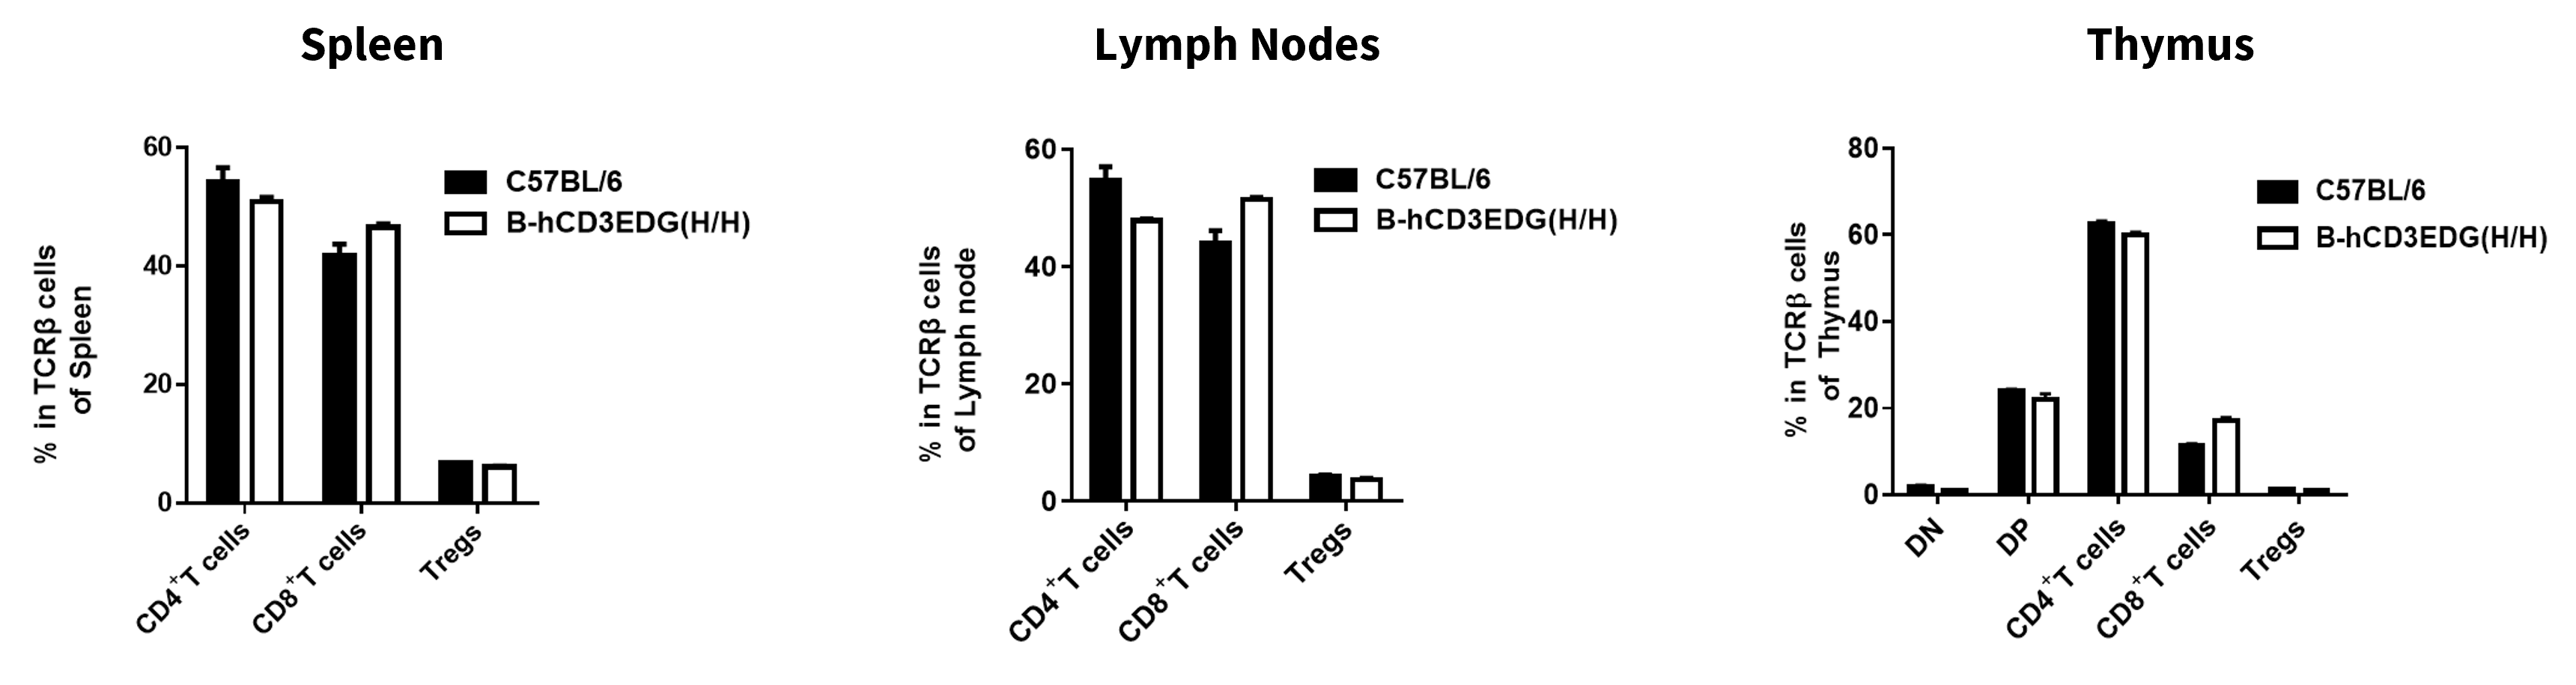
Analysis of T Cell Subpopulations
- The proportions of CD4⁺ T cells, CD8⁺ T cells, and Tregs in homozygous B-hCD3EDG mice were comparable to those in C57BL/6 mice.
- Humanization of CD3E, CD3D, CD3G, and does not affect normal T cell development, differentiation, or distribution.
Analysis of T-cell subpopulations by flow cytometry in immune organs. Splenocytes, lymph nodes, and thymus were isolated from C57BL/6 and B-hCD3EDG mice (7-week-old, n = 3). Single live cells were gated on the mTCRβ+ T-cell population and analyzed by flow cytometry as indicated. Values are expressed as mean ± SEM
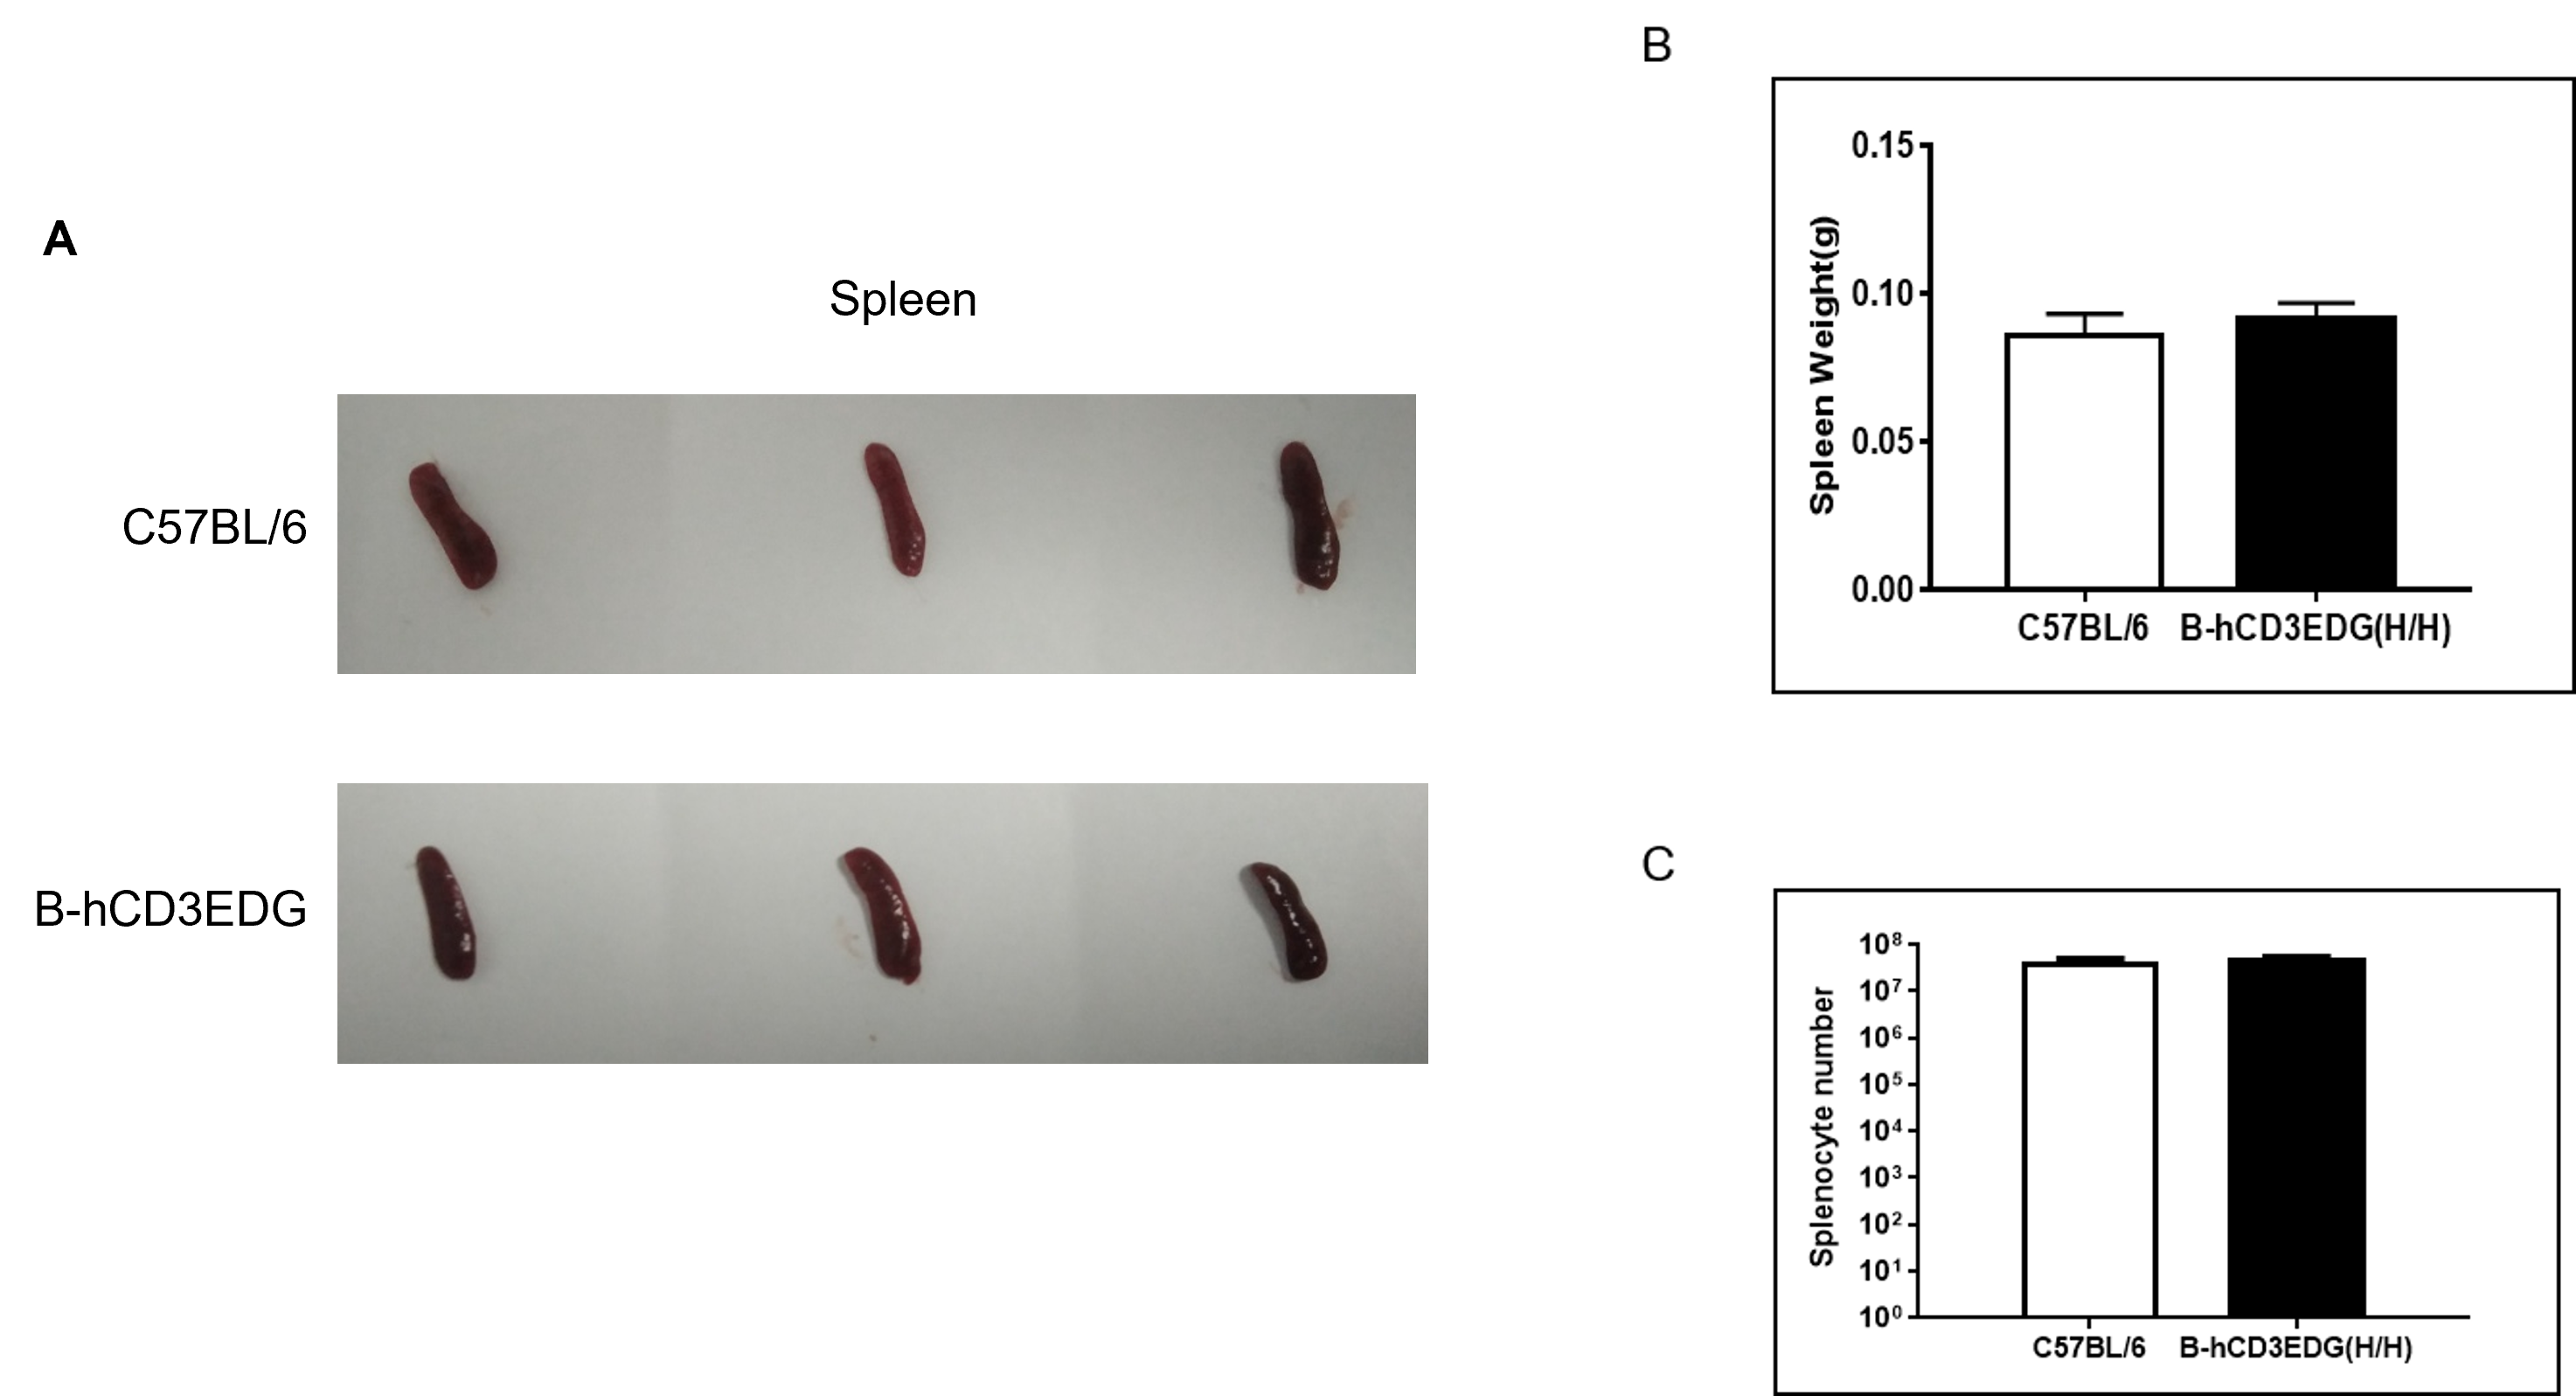
Organ Weight and Total Cell Number of Splenocytes
(A) Size of spleen from C57BL/6 and B-hCD3EDG mice (n=3, 7-week-old). (B) The weight of spleen in C57BL/6 and B-hCD3EDG mice was similar. (C) The number of splenocytes in C57BL/6 and B-hCD3EDG mice was similar.
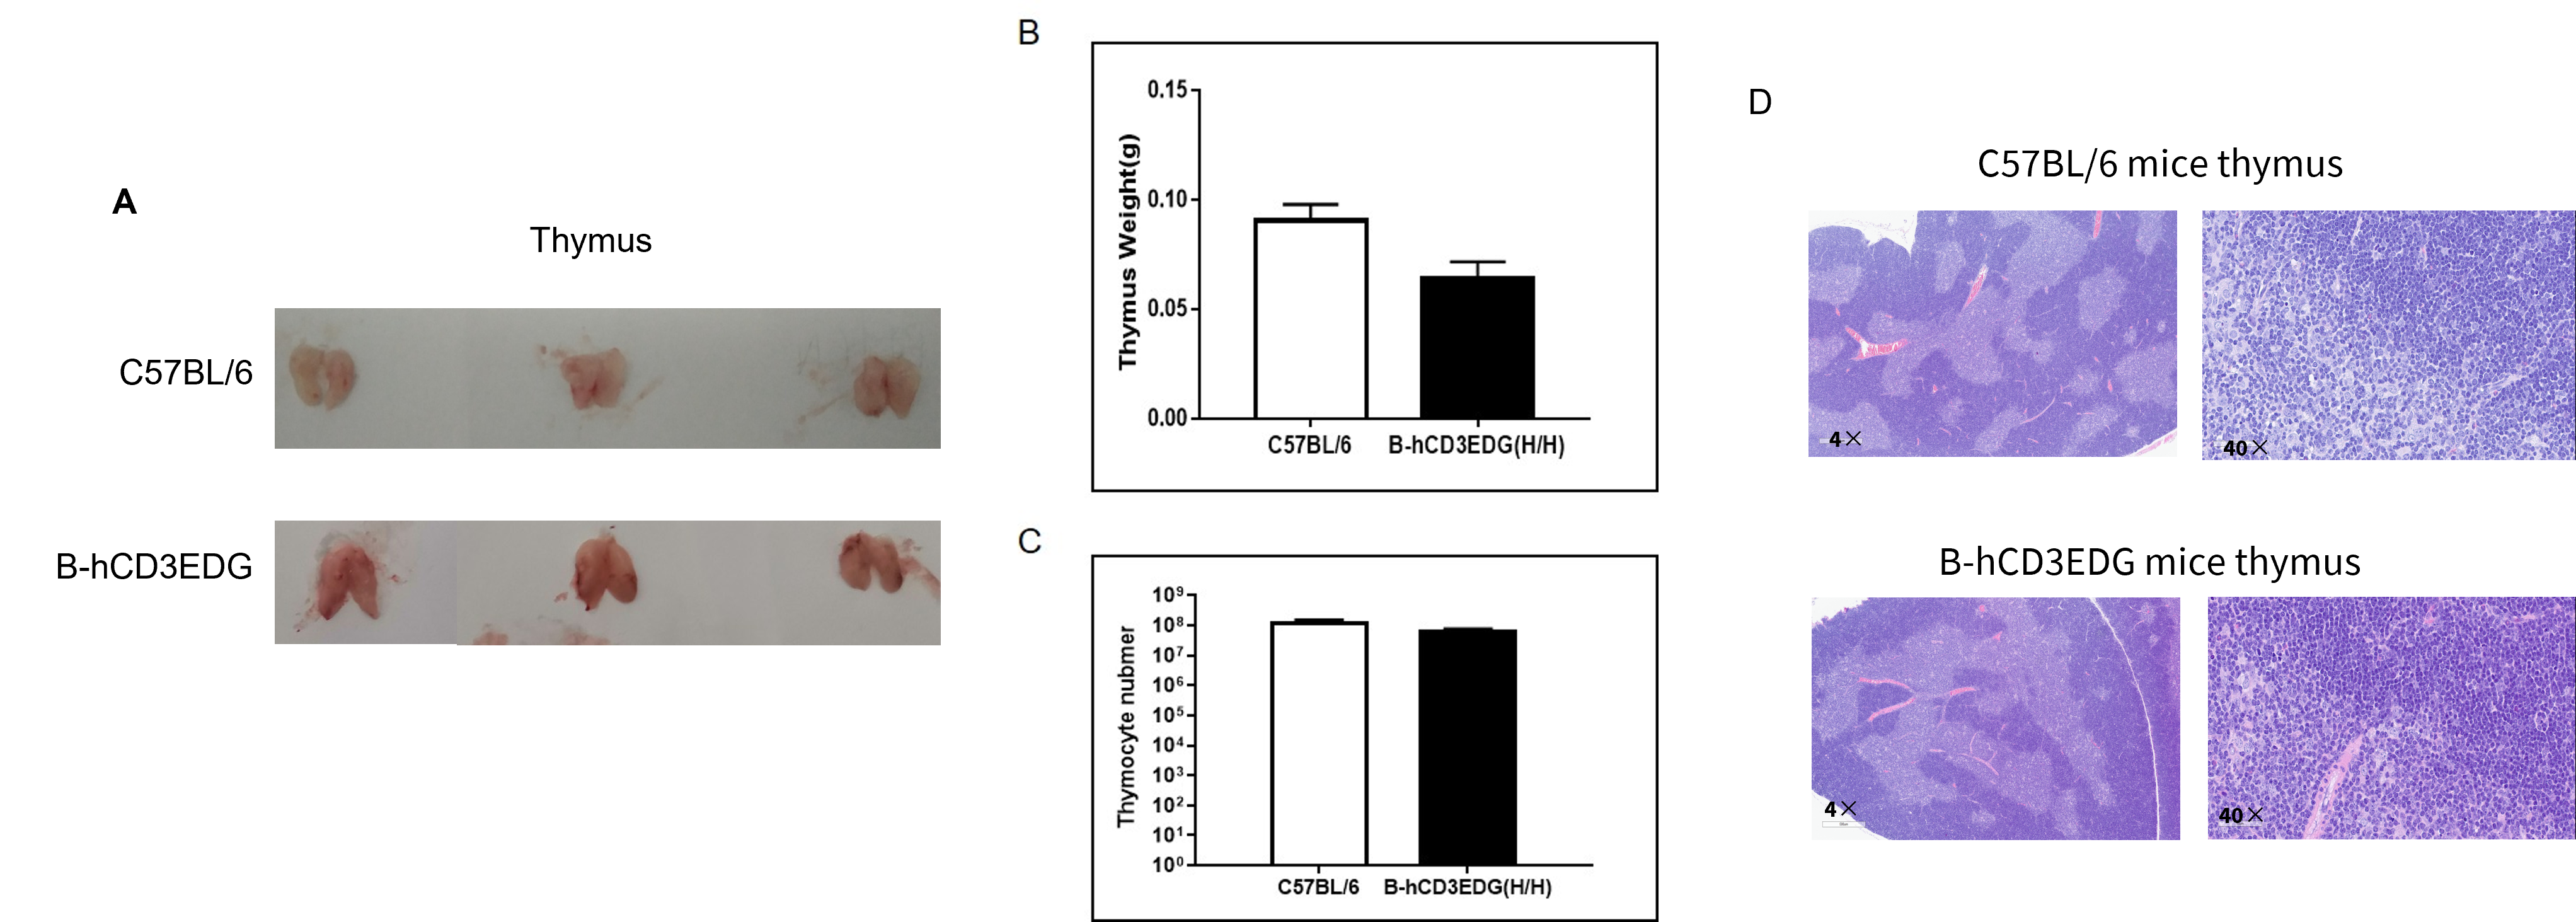
Organ Weight and Total Cell Number of Thymocytes
(A) Size of thymus from C57BL/6 and B-hCD3EDG mice (n=3, 7-week-old). (B) The weight of thymus in B-hCD3EDG mice was lower than that in C57BL/6 mice. (C) The number of thymocytes in B-hCD3EDG mice was lower than that in C57BL/6. (D) The thymus of B-hCD3EDG mice (female, 8-week-old, n=3) showed no significant abnormal changes, with clear boundaries between the cortex and medulla and normal cell morphology.
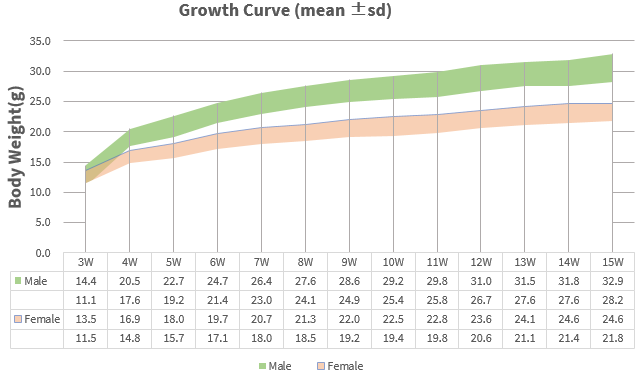
Growth Curve
Growth curve of B-hCD3EDG mice. Three weeks old of newborn pups were obtained at weaning (20 males and 20 females, respectively). Body weight was measured on the same day of every week and lasted for 15 weeks. The lowest and highest values of mouse body weight in the table were calculated from the mean ± SD.
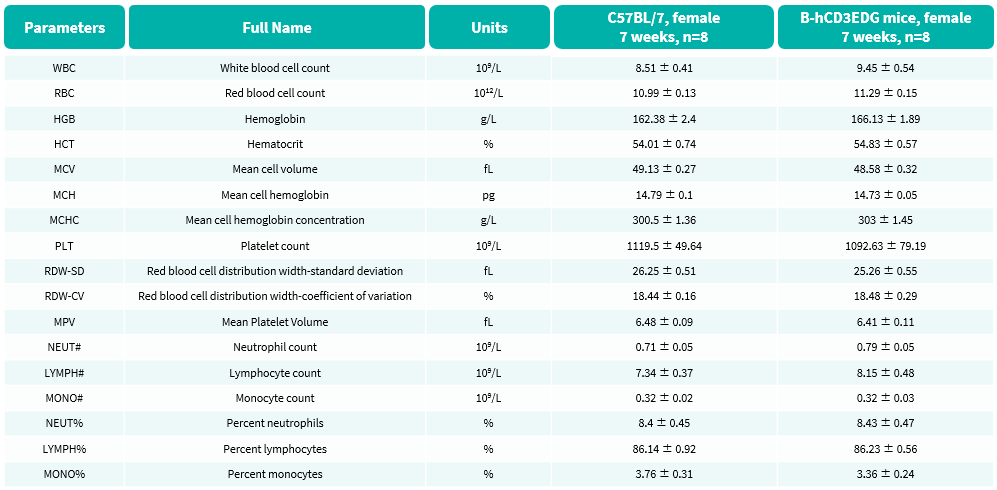
Hematology Analysis
- No significant differences were observed compared with wild-type mice.
Complete blood count (CBC) of B-hCD3EDG mice. Values are expressed as mean ± SEM.
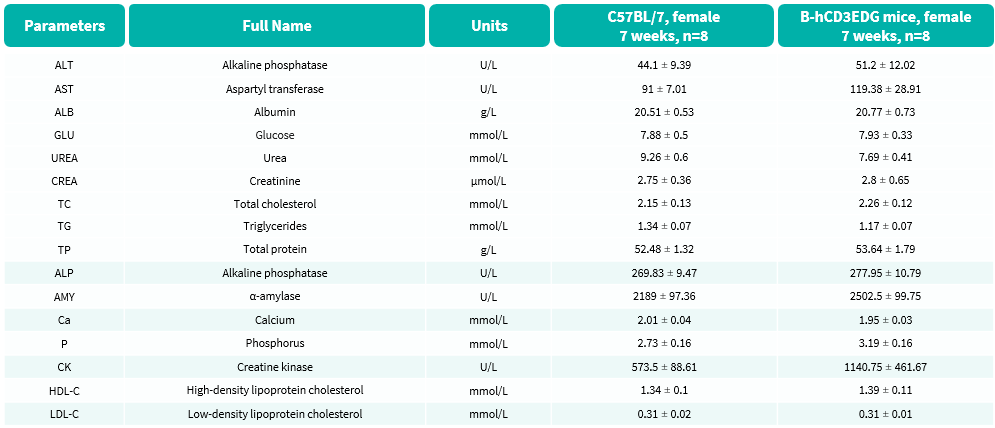
Blood Biochemical Analysis
- No significant differences were observed compared with wild-type mice.
Blood biochemical parameters of B-hCD3EDG mice are shown. Values are expressed as mean ± SEM.
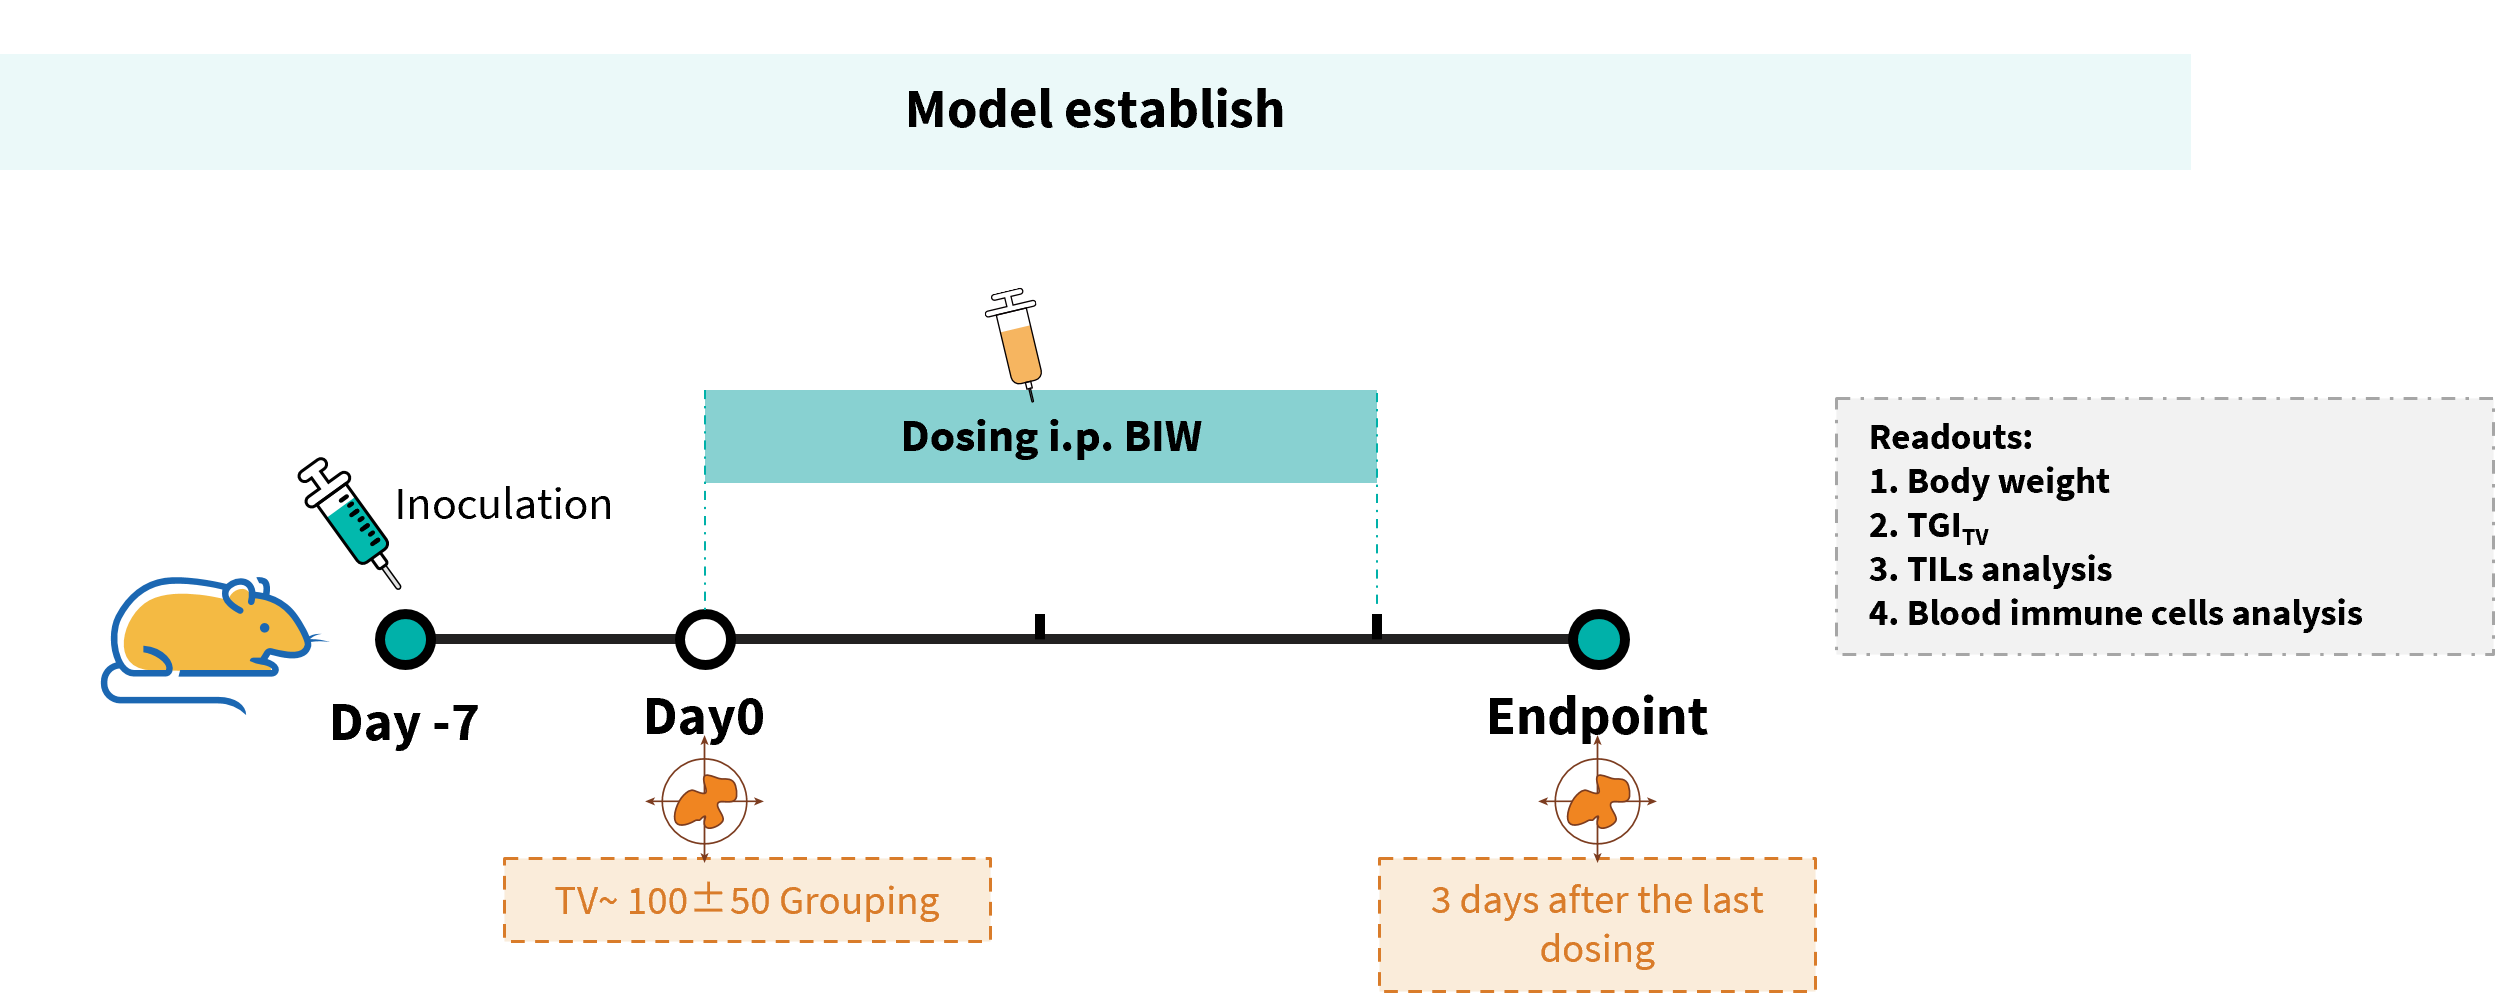
Efficacy evalsuation of anti-hCD3ε Antibody and anti-mPD-1 Antibody in the Treatment of the Subcutaneous MC38 Model in B-hCD3EDG mice
Establishment of a MC38 model and in vivo efficacy study of anti-hCD3ε antibody and anti-mPD-1 antibody . Murine colon cancer MC38 cells were implanted subcutaneously into homozygous B-hCD3EDG mice (female, 8 weeks old, n = 5). When the average tumor volume reached approximately 100±50 mm³, mice were randomized and subsequently administered with anti-mPD-1 antibody (Purchase from BioXCell) or anti-CD3ε antibody (Teplizumab, in house) via intraperitoneal injection.
Efficacy of anti-hCD3ε antibody and anti-mPD-1 antibody in B-hCD3EDG mice. (A) Tumor growth curves. (B) Body weight changes during treatment. As shown in panel A, anti-mPD-1 antibody significantly inhibited tumor growth in B-hCD3EDG mice, indicating their T cells function normally. However, the tumor growth was faster after anti-hCD3ε antibody treatment, which may be caused by activation induced cell death (AICD). Values are expressed as mean ± SEM.
The overage of this tumor model is 60%.
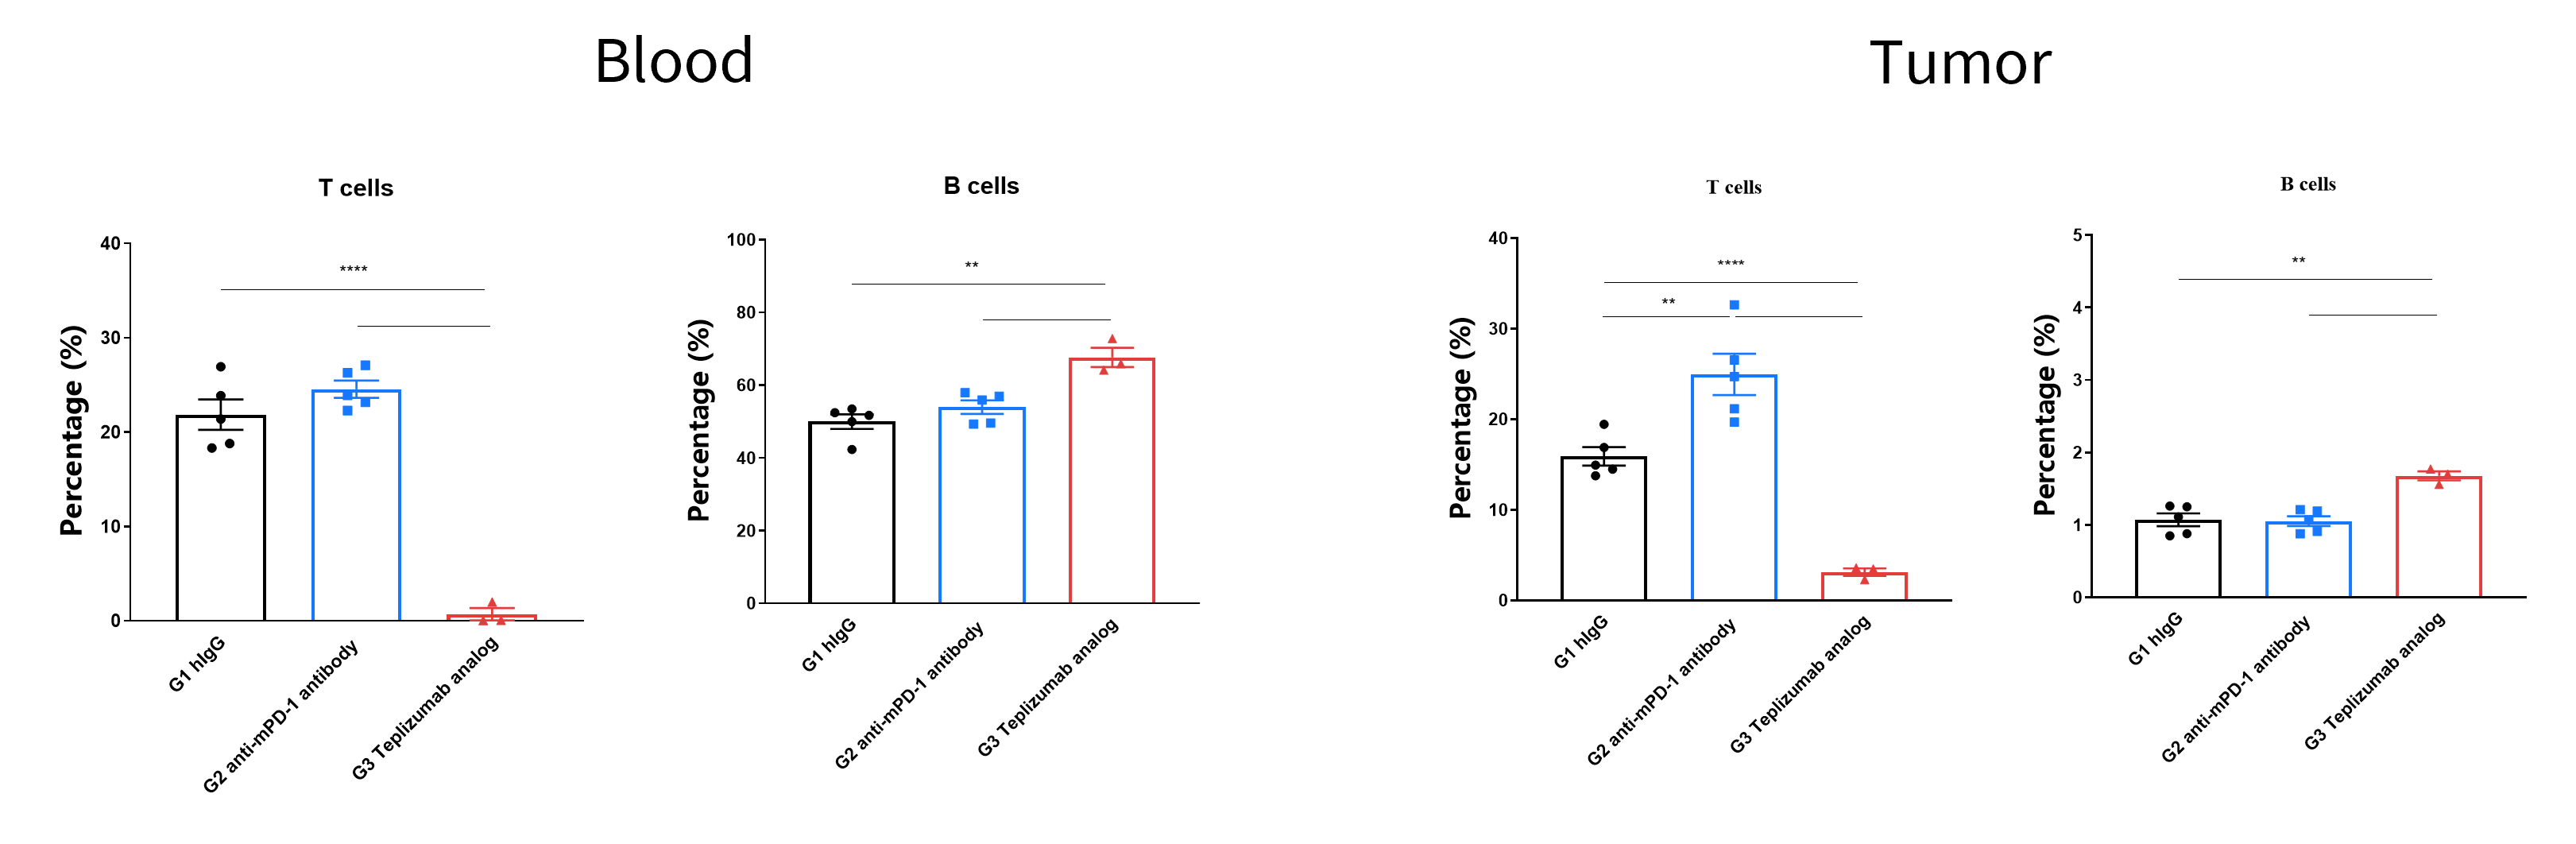
Efficacy evalsuation of anti-hCD3ε Antibody and anti-mPD-1 Antibody in the Treatment of the Subcutaneous MC38 Model in B-hCD3EDG mice
- The proportions of T cells in blood and tumor were significantly decreased due to the activation induced cell death (AICD) effect caused by anti-hCD3ε antibody treatment.
T cells and B cells activation analysis. Lymphocytes were isolated from peripheral blood and tumor at the endpoint of the in vivo experiment. The proportions of T cells and B cells in total CD45+ cells were shown. In the anti-hCD3ε antibody treatment group, the proportion of T cells was significantly decreased due to the activation induced cell death (AICD) effect caused by anti-hCD3ε antibody treatment.
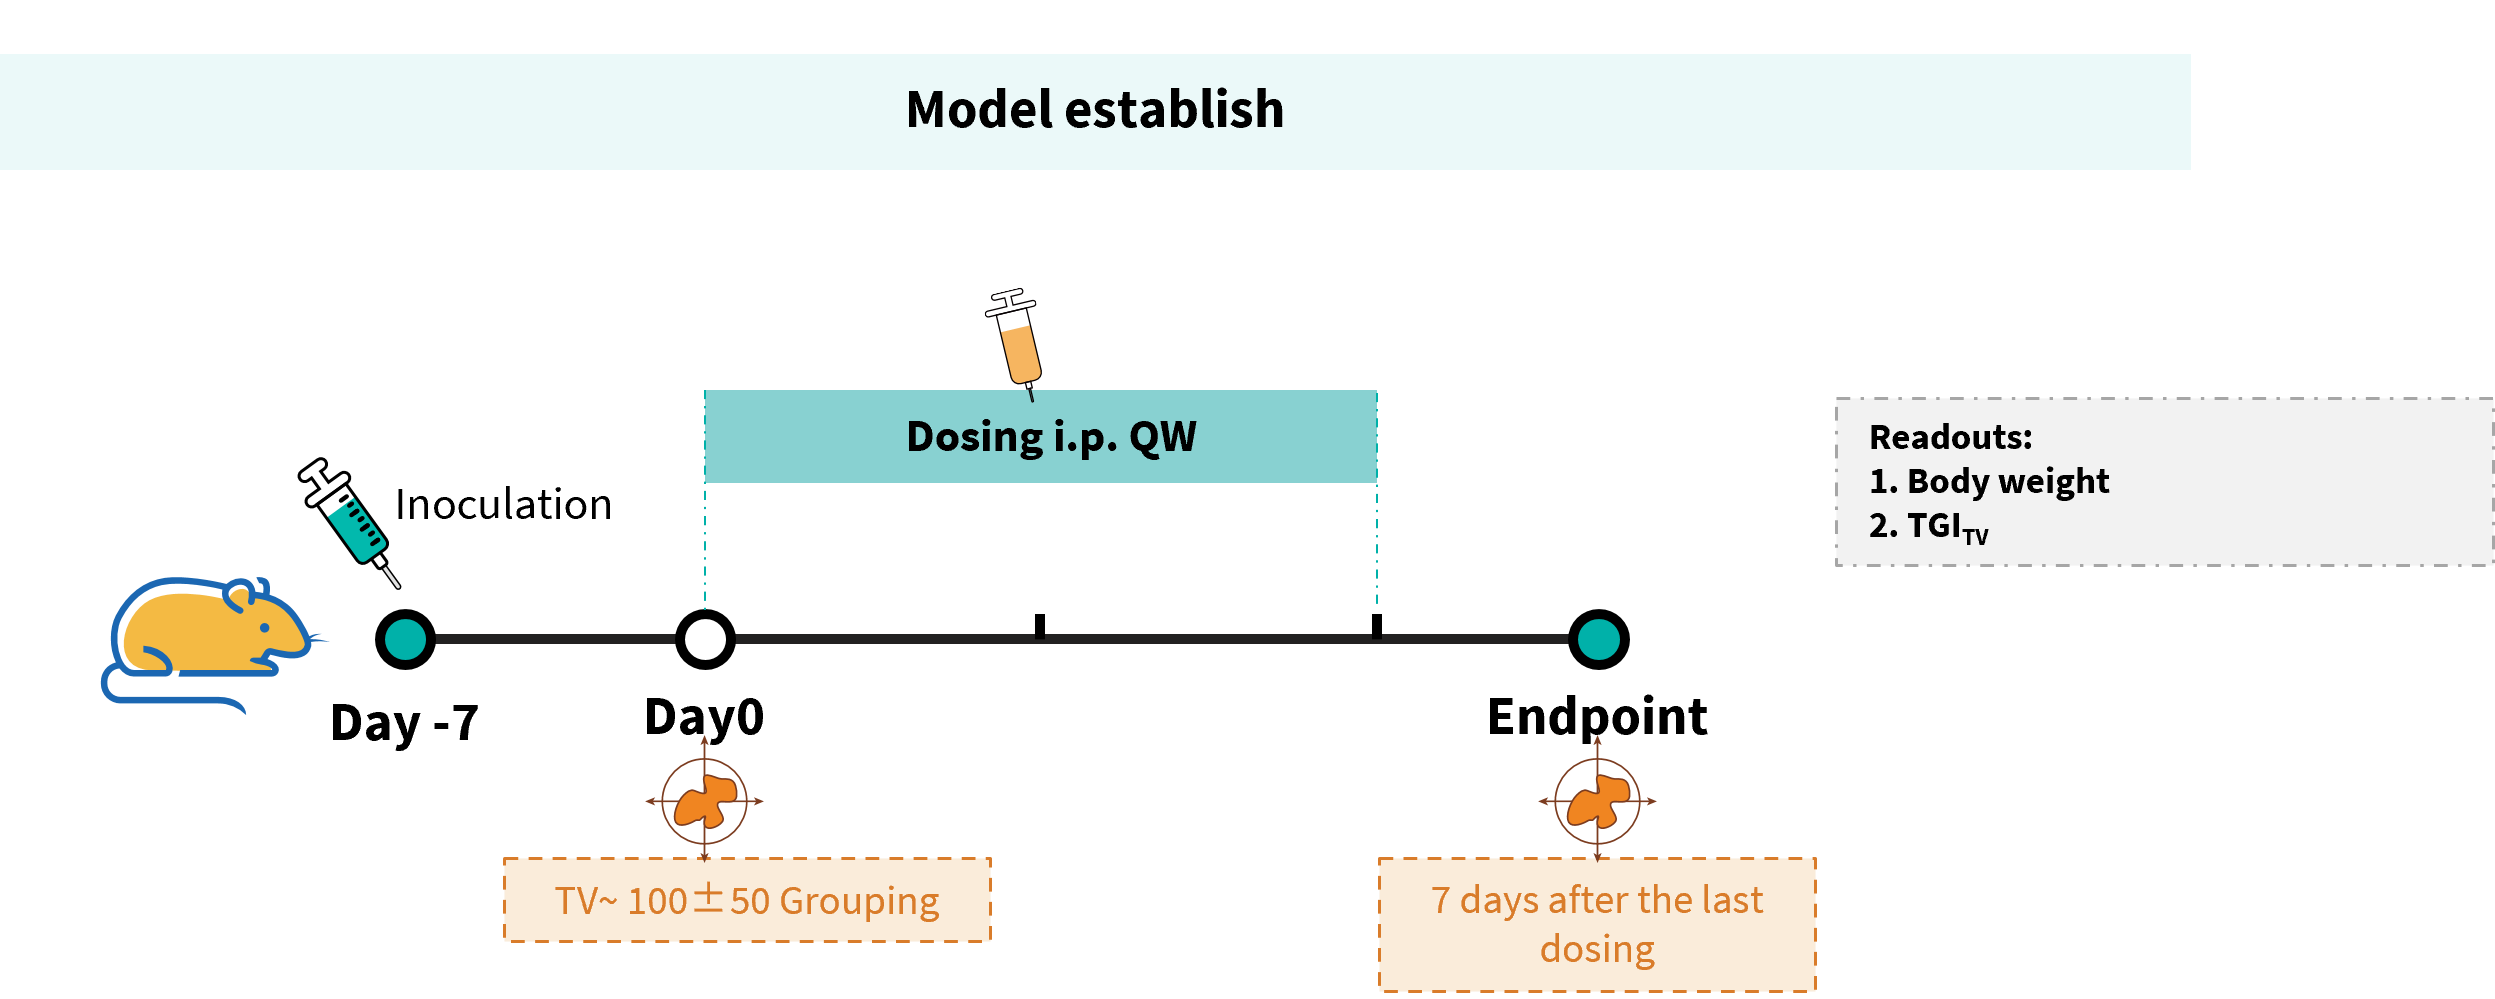
Efficacy evalsuation of Glofitamab in the Treatment of the Subcutaneous B-hCD20 MC38 Model in B-hCD3EDG mice
Establishment of a B-hCD20 MC38 model and in vivo efficacy study of Glofitamab. B-hCD20 MC38 mouse colon carcinoma cells were subcutaneously implanted into homozygous B-hCD3EDG mice (female, 7-week-old, n=6). Mice were grouped once tumor volume reached approximately 100 mm³, at which time they were injected intravenously with anti-human CD3/CD20 bispecific antibodies (Glofitamab analog, Commercial).
Efficacy of anti-human CD3/CD20 bispecific antibodies (Glofitamab, Commercial) in B-hCD3EDG mice. (A) Tumor growth curves. (B) Body weight changes during treatment. As shown in panel A, anti-human CD3/CD20 bispecific antibodies inhibited B-hCD20 MC38 tumor growth in B-hCD3EDG mice. Values are expressed as mean ± SEM.
The overage of this tumor model is 60%.
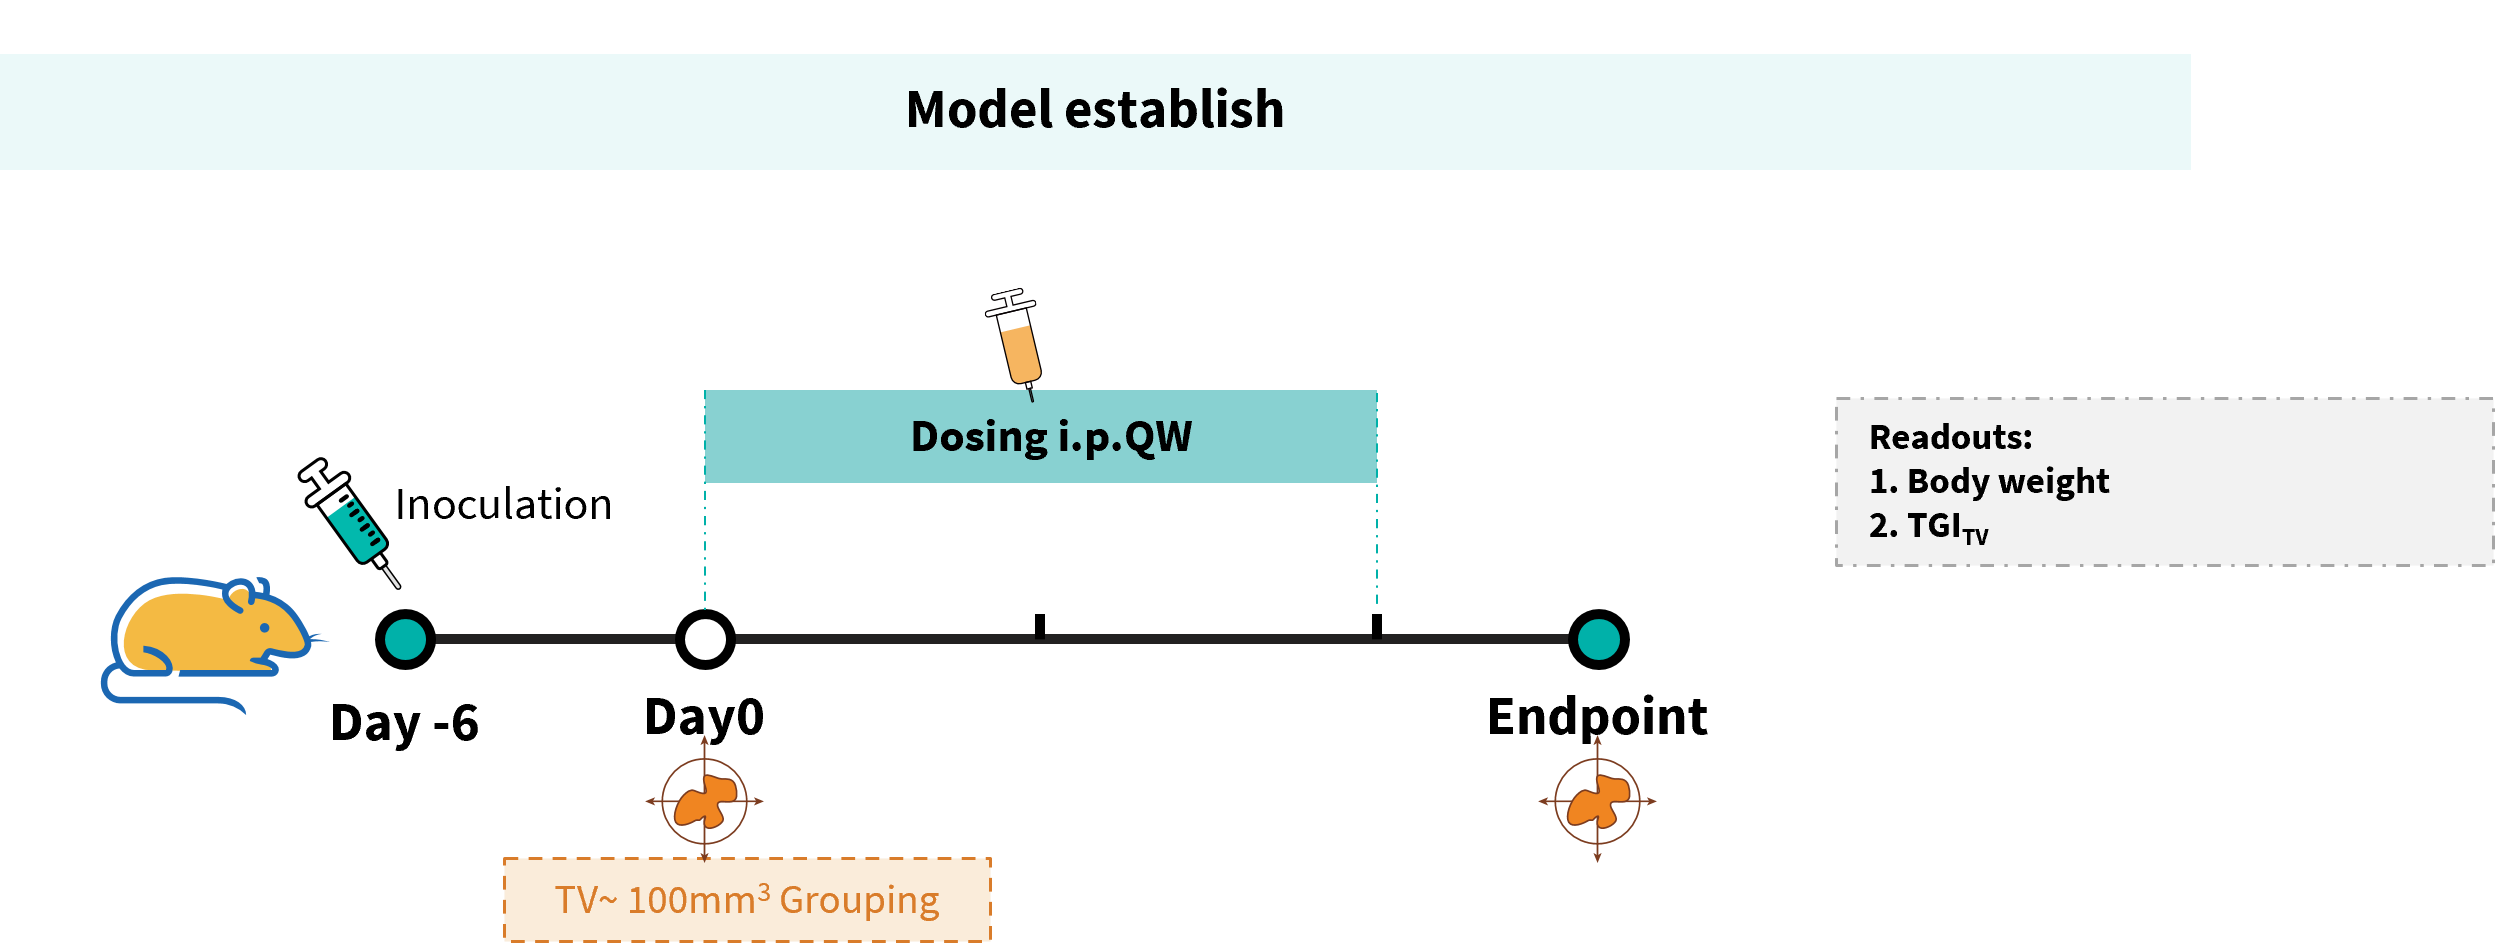
Efficacy evalsuation of Tarlatamab in the Treatment of the Subcutaneous B-hDLL3 B16-F10 Model in B-hCD3EDG mice
Establishment of a B-hDLL3 B16-F10 model and in vivo efficacy study of Tarlatamab. B-hDLL3 B16-F10 mouse melanoma cells were subcutaneously implanted into homozygous B-hCD3EDG mice (female, 7–9-week-old, n=6). Mice were grouped when tumor volume reached approximately 100 ± 20 mm³, at which time they were injected intraperitoneally with anti-human CD3/DLL3 bispecific antibodies (Tarlatamab analog, in-house).
Efficacy of anti-human CD3/DLL3 bispecific antibodies (Tarlatamab, in-house) in B-hCD3EDG mice. (A) Tumor growth curves. (B) Body weight changes during treatment. As shown in panel A, Anti-human CD3/DLL3 bispecific antibodies inhibited B-hDLL3 B16-F10 tumor growth in B-hCD3EDG mice. Values are expressed as mean ± SEM.
The overage of this tumor model is 100%.
Efficacy evalsuation of Xaluritamig in the Treatment of the Subcutaneous B-hSTEAP1 MC38 Model in B-hCD3EDG mice
Establishment of a B-hSTEAP1 MC38 model and in vivo efficacy study of Xaluritamig. B-hSTEAP1 MC38 mouse colon carcinoma cells were subcutaneously implanted into homozygous B-hCD3EDG mice (female, 10-week-old, n=6). Mice were grouped once tumor volume reached approximately 100 mm³, at which time they were injected intraperitoneally with anti-human CD3/STEAP1 bispecific antibodies (Xaluritamig analog, Commercial).
Efficacy of anti-human CD3/STEAP1 bispecific antibodies (Xaluritamig, Commercial) in B-hCD3EDG mice. (A) Tumor growth curves. (B) Body weight changes during treatment. As shown in panel A, anti-human CD3/STEAP1 bispecific antibodies inhibited B-hSTEAP1 MC38 tumor growth in B-hCD3EDG mice. Values are expressed as mean ± SEM.
The overage of this tumor model is 60%.
* When publishing results obtained using this animal model, please acknowledge the source as follows: The animal model [B-hCD3EDG mice] (Cat# 110039) was purchased from Biocytogen.